

Question
Question 1: By examining the single channel recordings above, identify which (time-course) diagram (i, ii or iii) best describes the final equilibrium distribution of these
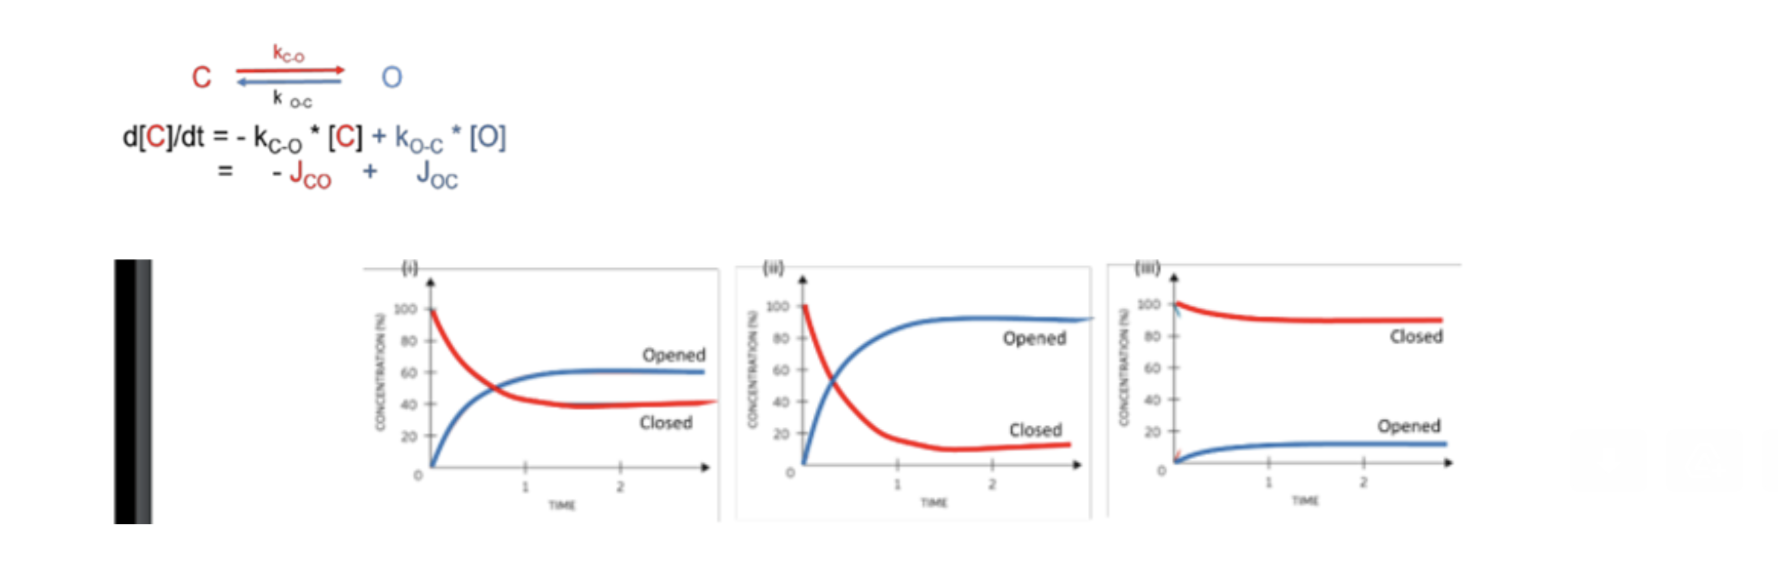
Question 1: By examining the single channel recordings above, identify which (time-course) diagram (i, ii or iii) best describes the final equilibrium distribution of these channels for a step to +40mV (from -100mV)?
Question 2: Which rate constant is larger at -100mV (kO-C or kC-O)? Which rate constant is larger at +40mV (kO-C or kC-O)?
Question 3: Notice that the concentration units above (in part a) are in units of %concentration. What this means is that the graph is showing relative numbers. How would you estimate the probability of the channels being in the O versus C states from these graphs?
Question 4: Explain why for isomerizations reactions it is always possible (in principle) to estimate the probability of being in the O state and the probability of being in the C state.
Please answer each question separately and according to the given graph, thanks
Cd[C]/dt=ko=kc0[C]+kOc[O]Step by Step Solution
There are 3 Steps involved in it
Step: 1

Get Instant Access to Expert-Tailored Solutions
See step-by-step solutions with expert insights and AI powered tools for academic success
Step: 2

Step: 3
Ace Your Homework with AI
Get the answers you need in no time with our AI-driven, step-by-step assistance
Get Started
Chemistry The Central Science
Authors: Theodore Brown, H. LeMay, Bruce Bursten, Catherine Murphy, Patrick Woodward, Matthew Stoltzfus
14th Edition
9780134414232