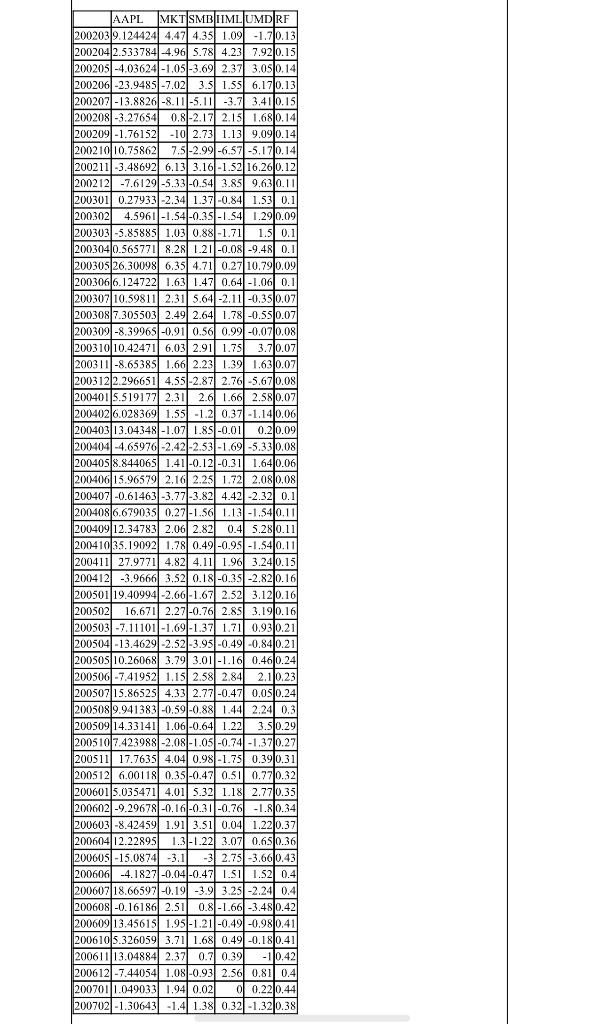
Question 1) Carhart (1997) extends the Fama French three factor model to a four factor model. That is, there are four factors in the markets, which are MKT, SMB, HML and UMD. The risk free rate is RF. You are given returns data for a stock, AAPL, from March 2002 to Feburary 2007, with a monthly frequency. a) Test whether CAPM holds for AAPL. b) Does this stock offer a positive alpha, how large is it? c) Please calculate the betas (exposures) of AAPL corresponding to these four factors. d) How is the performance of the fourth factor UMD in explaining returns of AAPL. AAPL MKT SMBIIML UMDRF 200203 9.124424 4,471 4.35 1.09 -1.710.13 2002042.533784-4.96 5.78 4.23 7.92 0.15 200205 -4.03624 -1.05 -3.69 2.37 3.05 0.14 200206 -23.9485-7.021 3.5 1.55 6.170.13 200207-13.8826-8.11-5.11 -3.7 3.410.15 200208 -3.27654 0.8-2.17 2.15 0.8-2.17 2.15 1.680.14 200209 -1.76152 -10 2.73 1.139.090.14 Power 200210110.75862| Pran 7.5 -2.99-6.57 -5.170.14 200211 -3.48692 6.13 3.16-1.52 16.26 0.12 Wat 200212 -7.6129-5.33 -0.54 3.85 9.630.11 200301 0.27933 -2.34 1.37 -0.84 1.53 0.1 200302 12 4.5961 -1.54 -0.35 -1.54 1.290.09 . 2003031-5.85885 1.03 0.88 -1.71 1.5 0.1 2003040.565771 8.2 1.21 -0.08 -9.48 0.1 200305 26.30098 6.35 4.71 0.27 10.790.09 200306 6.124722 1.63 1.47 0.64 -1.06 0.1 200307 10.59811 2.31 5.64 -2.11 -0.350.07 200308 7.305503 2.49 2.64 1.78 -0.55 0.07 200309 -8.39965-0.91 0.56 0.99-0.07 0.08 B 200310 10.42471/ 6.032.91 1.75 3.7 0.07 200311-8.65385 1.66 2.23 1.39 1.630.07 Pa 200312 2.296651 4.55 -2.87 2.76 -5.670.08 20040115.519177 2.31 2.6 1.66 2.580.07 2004026.028369 1.55 -1.2 0.37 -1.140.06 200403 13.04348 -1.07 1.85 -0.01 0.2 0,09 . 200404-4.65976 -2.42 -2.53 -1.69-5.33 0.08 200405 8.844065 1.41 -0.12 -0.31 1.640.06 och 20040615.965792.162.25 1.721 2.080.08 Deva 200407 -0.61463 -3.77-3.82 4.42 -2.32 0.1 osteoclasti 2004086.679035 0.27 -1.56 1.13 -1.5410.11 20040912.347831 2.061 2.82 0.4 5.280.111 Bowl 200410 35.19092 1.78 0.49 -0.95 -1.540.11 200411| 27.9771| 4.82 4.11 1.96 3.240.15 2004120 -3.9666 3.52 0.18-0.351 -2.820.16 200501 19.40994-2.66 -1.67 2.52 3.120.16 200502 16.671 2.27 -0.76 2.85 3.190.16 200503 -7.11101 -1.69 -1.371 1.71 0.930.21 200504-13.4629-2.521-3.95 -0.49 -0.84 0.21 20050S 10.26068 3.79 3.01 -1.16 0.460.24 200506 -7.41952 1.15 2.58 2.84 2.110.23 200507 15.86525 4.33 2.77 -0.47 0.05 0.24 2005089.941383-0.59-0.88 1.44 2.24 0.3 20050914.33141 1.06 -0.64 1.22 3.5 0.29 2005107.423988)-2.08 -1.05 -0.74 -1.37 0.27 200511 17.76351 4.04 0.98 -1.75 0.39 0.31 2005126.00118 0.35 -0.47 0.51 0.7710.32 2006015.035471 4.01 5.32 1.18 2.770.35 200602) -9.29678 -0.16-0.31 -0.76 -1.80.34 200603 -8.42459 1.91 3.51 0.04 1.22 0.37 HT 20060412.22895 1.3 -1.22 3.071 0.6510.36 200605 -15,0874 -3.1 -3 2.75 -3.660.43 200606 -4.1827 -0.04 -0.47 1.SI 1.52 0.4 Samen acceso 200607_18.66597 -0.19 -3.9 3.25 -2.24 0.4 becon 200608-0.16186 2.51 0.8-1.66 -3.480.42 20060913.45615 1.95 -1.21 -0.491-0.980.41 2006105.326059 3.711 1.68 0.49 -0.18 0.41 200611|13.04884 2.371 0.71 0.39 - 10.42 200612 -7.44054 1.08-0.93 2.56 0.81 0.4 200701|1.049033 1.94 0.02 0 0.22 0.44 200702 -1.30643 -1.4 1.38 0.32-1.320.38 Question 1) Carhart (1997) extends the Fama French three factor model to a four factor model. That is, there are four factors in the markets, which are MKT, SMB, HML and UMD. The risk free rate is RF. You are given returns data for a stock, AAPL, from March 2002 to Feburary 2007, with a monthly frequency. a) Test whether CAPM holds for AAPL. b) Does this stock offer a positive alpha, how large is it? c) Please calculate the betas (exposures) of AAPL corresponding to these four factors. d) How is the performance of the fourth factor UMD in explaining returns of AAPL. AAPL MKT SMBIIML UMDRF 200203 9.124424 4,471 4.35 1.09 -1.710.13 2002042.533784-4.96 5.78 4.23 7.92 0.15 200205 -4.03624 -1.05 -3.69 2.37 3.05 0.14 200206 -23.9485-7.021 3.5 1.55 6.170.13 200207-13.8826-8.11-5.11 -3.7 3.410.15 200208 -3.27654 0.8-2.17 2.15 0.8-2.17 2.15 1.680.14 200209 -1.76152 -10 2.73 1.139.090.14 Power 200210110.75862| Pran 7.5 -2.99-6.57 -5.170.14 200211 -3.48692 6.13 3.16-1.52 16.26 0.12 Wat 200212 -7.6129-5.33 -0.54 3.85 9.630.11 200301 0.27933 -2.34 1.37 -0.84 1.53 0.1 200302 12 4.5961 -1.54 -0.35 -1.54 1.290.09 . 2003031-5.85885 1.03 0.88 -1.71 1.5 0.1 2003040.565771 8.2 1.21 -0.08 -9.48 0.1 200305 26.30098 6.35 4.71 0.27 10.790.09 200306 6.124722 1.63 1.47 0.64 -1.06 0.1 200307 10.59811 2.31 5.64 -2.11 -0.350.07 200308 7.305503 2.49 2.64 1.78 -0.55 0.07 200309 -8.39965-0.91 0.56 0.99-0.07 0.08 B 200310 10.42471/ 6.032.91 1.75 3.7 0.07 200311-8.65385 1.66 2.23 1.39 1.630.07 Pa 200312 2.296651 4.55 -2.87 2.76 -5.670.08 20040115.519177 2.31 2.6 1.66 2.580.07 2004026.028369 1.55 -1.2 0.37 -1.140.06 200403 13.04348 -1.07 1.85 -0.01 0.2 0,09 . 200404-4.65976 -2.42 -2.53 -1.69-5.33 0.08 200405 8.844065 1.41 -0.12 -0.31 1.640.06 och 20040615.965792.162.25 1.721 2.080.08 Deva 200407 -0.61463 -3.77-3.82 4.42 -2.32 0.1 osteoclasti 2004086.679035 0.27 -1.56 1.13 -1.5410.11 20040912.347831 2.061 2.82 0.4 5.280.111 Bowl 200410 35.19092 1.78 0.49 -0.95 -1.540.11 200411| 27.9771| 4.82 4.11 1.96 3.240.15 2004120 -3.9666 3.52 0.18-0.351 -2.820.16 200501 19.40994-2.66 -1.67 2.52 3.120.16 200502 16.671 2.27 -0.76 2.85 3.190.16 200503 -7.11101 -1.69 -1.371 1.71 0.930.21 200504-13.4629-2.521-3.95 -0.49 -0.84 0.21 20050S 10.26068 3.79 3.01 -1.16 0.460.24 200506 -7.41952 1.15 2.58 2.84 2.110.23 200507 15.86525 4.33 2.77 -0.47 0.05 0.24 2005089.941383-0.59-0.88 1.44 2.24 0.3 20050914.33141 1.06 -0.64 1.22 3.5 0.29 2005107.423988)-2.08 -1.05 -0.74 -1.37 0.27 200511 17.76351 4.04 0.98 -1.75 0.39 0.31 2005126.00118 0.35 -0.47 0.51 0.7710.32 2006015.035471 4.01 5.32 1.18 2.770.35 200602) -9.29678 -0.16-0.31 -0.76 -1.80.34 200603 -8.42459 1.91 3.51 0.04 1.22 0.37 HT 20060412.22895 1.3 -1.22 3.071 0.6510.36 200605 -15,0874 -3.1 -3 2.75 -3.660.43 200606 -4.1827 -0.04 -0.47 1.SI 1.52 0.4 Samen acceso 200607_18.66597 -0.19 -3.9 3.25 -2.24 0.4 becon 200608-0.16186 2.51 0.8-1.66 -3.480.42 20060913.45615 1.95 -1.21 -0.491-0.980.41 2006105.326059 3.711 1.68 0.49 -0.18 0.41 200611|13.04884 2.371 0.71 0.39 - 10.42 200612 -7.44054 1.08-0.93 2.56 0.81 0.4 200701|1.049033 1.94 0.02 0 0.22 0.44 200702 -1.30643 -1.4 1.38 0.32-1.320.38