Answered step by step
Verified Expert Solution
Question
1 Approved Answer
Question# 1 Comparative income statements and balance sheets for Saco World are shown below ($ millions). Income Statement Net Sales Cost of Goods Year
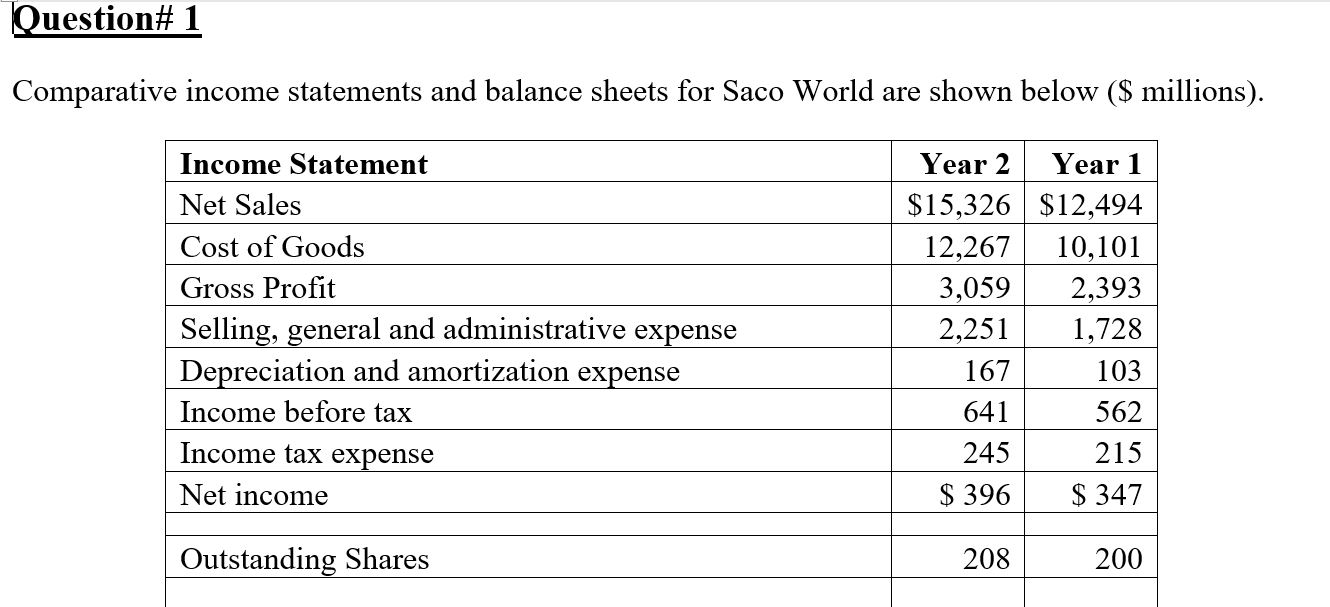
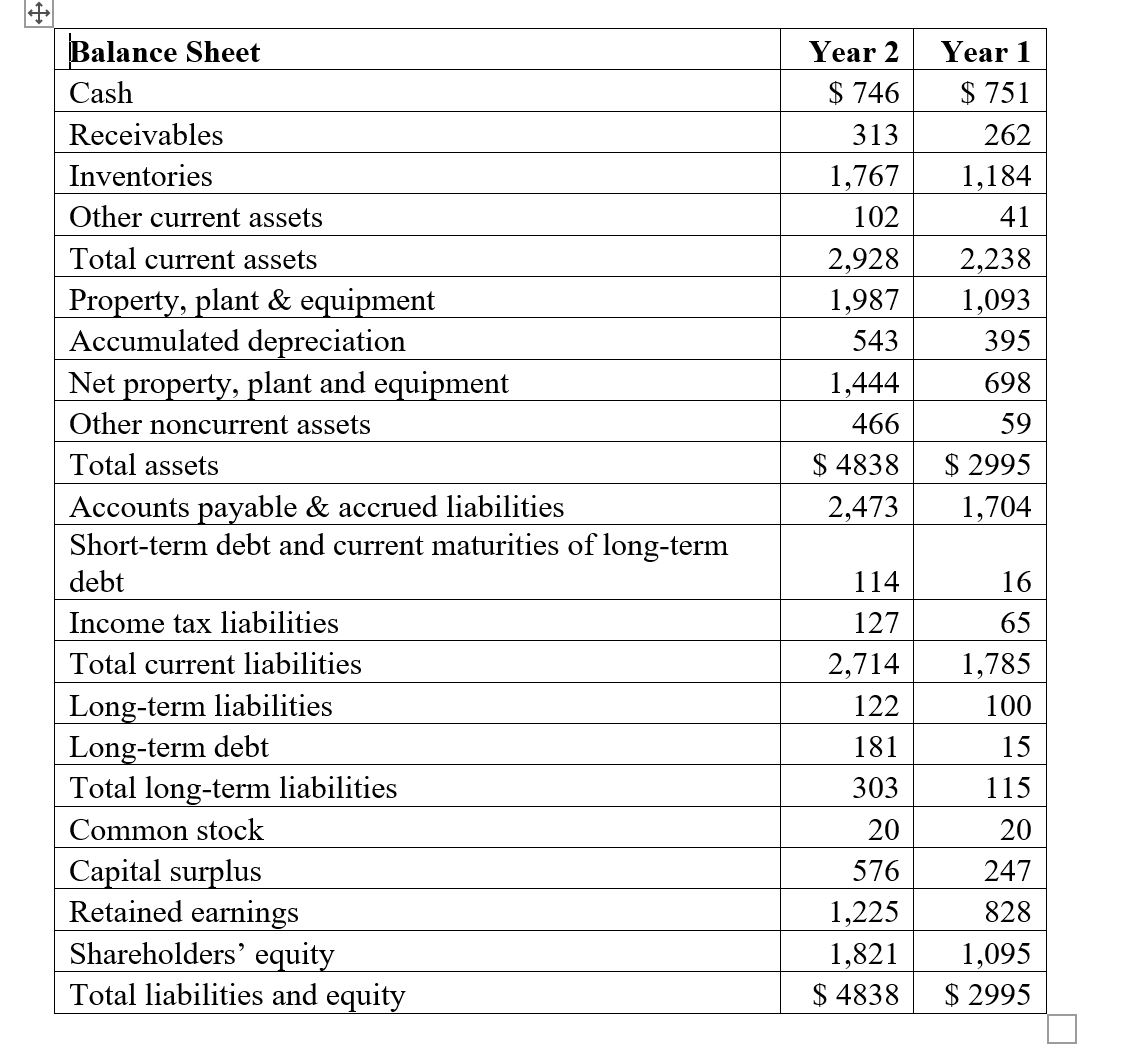
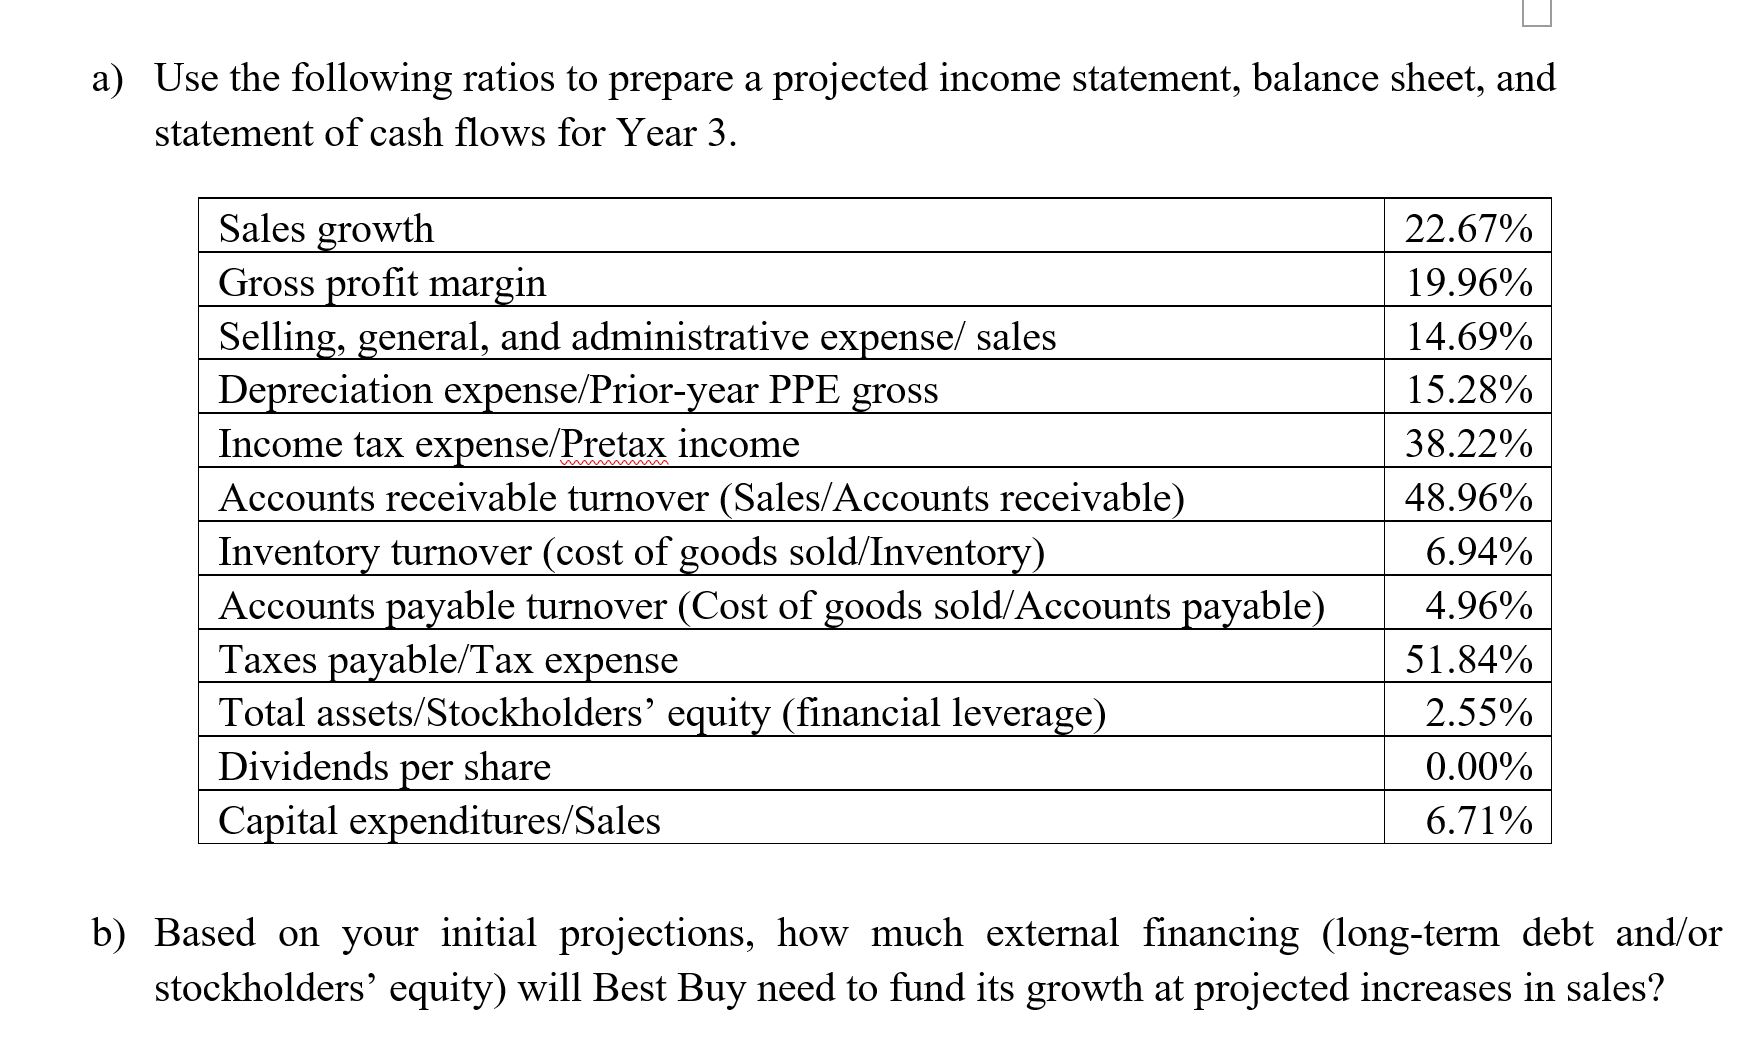
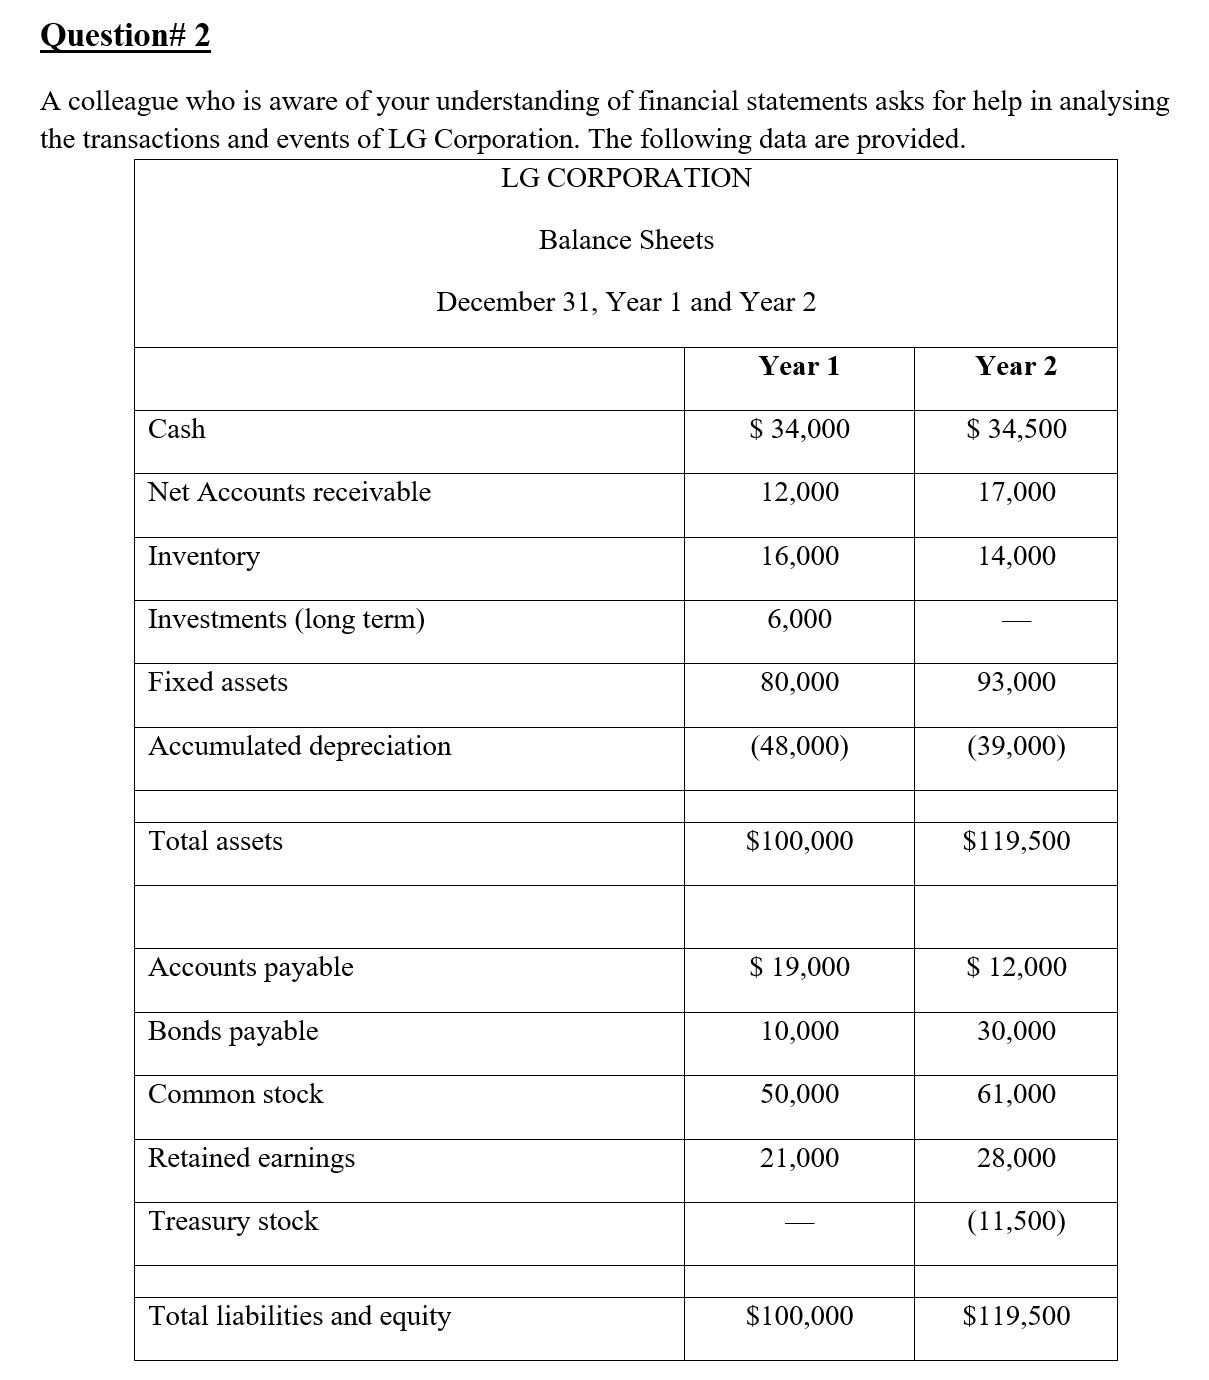
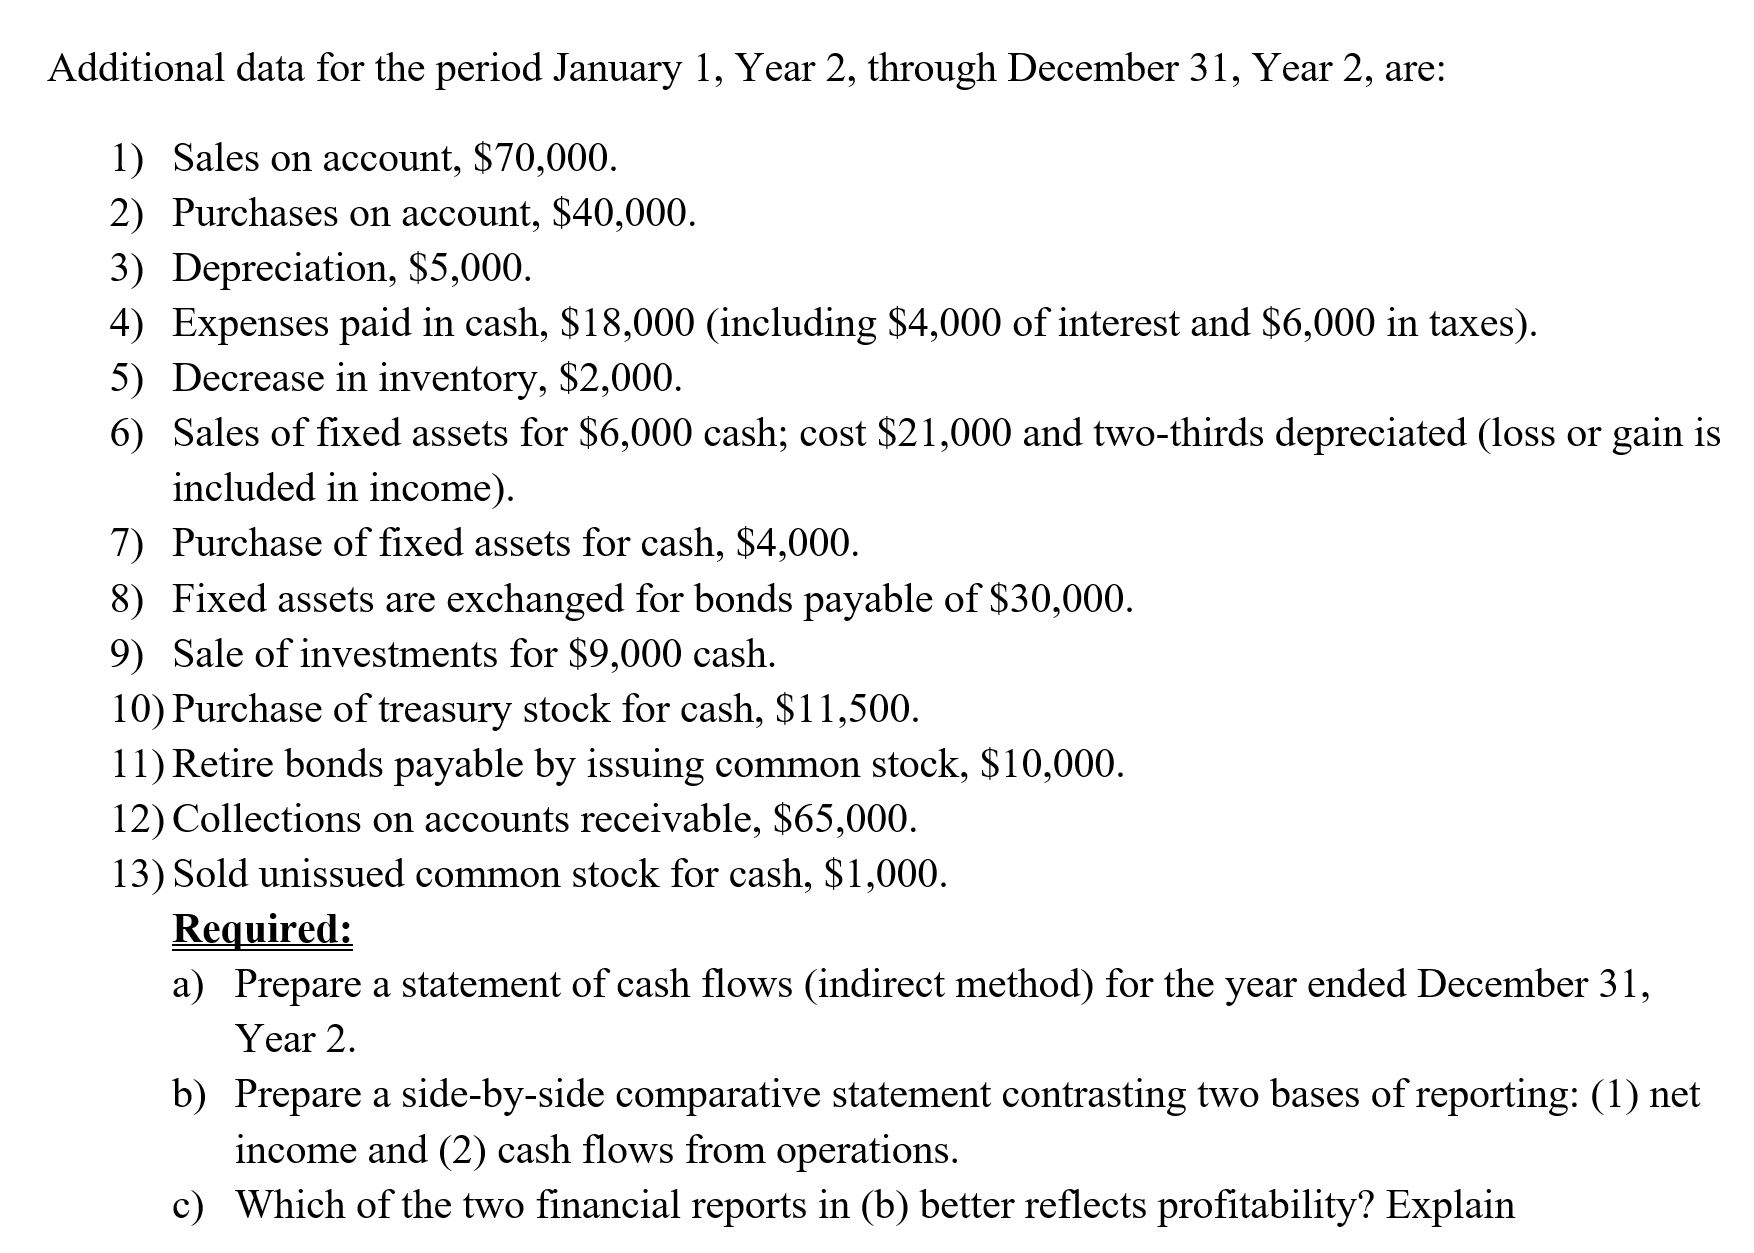
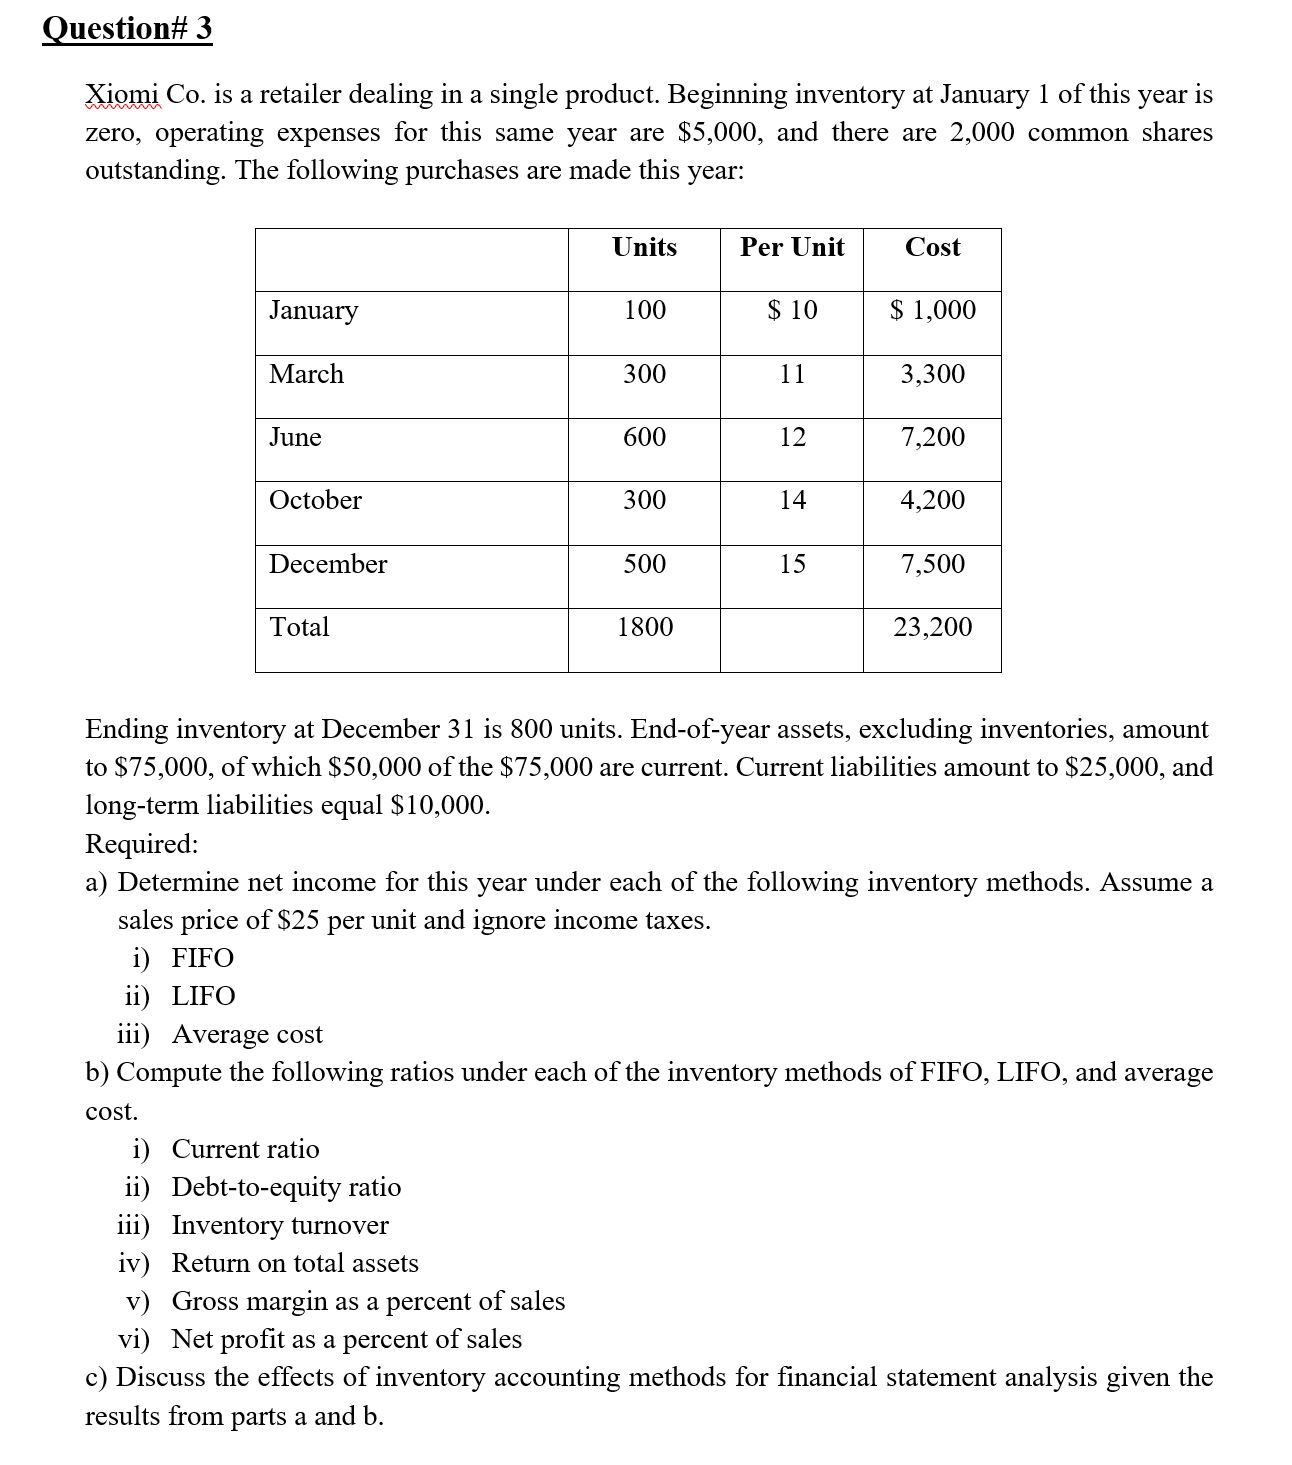
Question# 1 Comparative income statements and balance sheets for Saco World are shown below ($ millions). Income Statement Net Sales Cost of Goods Year 2 Year 1 $15,326 $12,494 Gross Profit Selling, general and administrative expense Depreciation and amortization expense Income before tax Income tax expense Net income Outstanding Shares 12,267 10,101 3,059 2,393 2,251 1,728 167 103 641 562 245 215 $ 396 $ 347 208 200 Balance Sheet Cash Receivables Inventories Other current assets Total current assets Property, plant & equipment Accumulated depreciation Net property, plant and equipment Other noncurrent assets Year 2 Year 1 $ 746 $ 751 313 262 1,767 1,184 102 41 2,928 2,238 1,987 1,093 543 395 1,444 698 466 59 Total assets Accounts payable & accrued liabilities $ 4838 $ 2995 2,473 1,704 Short-term debt and current maturities of long-term debt Income tax liabilities Total current liabilities 114 16 127 65 2,714 1,785 Long-term liabilities Long-term debt Total long-term liabilities Common stock 122 100 181 15 303 115 20 20 Capital surplus 576 247 Retained earnings 1,225 828 Shareholders' equity 1,821 1,095 Total liabilities and equity $ 4838 $ 2995 a) Use the following ratios to prepare a projected income statement, balance sheet, and statement of cash flows for Year 3. Sales growth 22.67% Gross profit margin 19.96% Selling, general, and administrative expense/ sales 14.69% Depreciation expense/Prior-year PPE gross 15.28% Income tax expense/Pretax income 38.22% Accounts receivable turnover (Sales/Accounts receivable) 48.96% Inventory turnover (cost of goods sold/Inventory) 6.94% Accounts payable turnover (Cost of goods sold/Accounts payable) 4.96% Taxes payable/Tax expense 51.84% Total assets/Stockholders' equity (financial leverage) 2.55% Dividends per share 0.00% Capital expenditures/Sales 6.71% b) Based on your initial projections, how much external financing (long-term debt and/or stockholders' equity) will Best Buy need to fund its growth at projected increases in sales? Question# 2 A colleague who is aware of your understanding of financial statements asks for help in analysing the transactions and events of LG Corporation. The following data are provided. LG CORPORATION Balance Sheets December 31, Year 1 and Year 2 Year 1 Year 2 Cash $ 34,000 $ 34,500 Net Accounts receivable 12,000 17,000 Inventory 16,000 14,000 Investments (long term) 6,000 Fixed assets 80,000 93,000 Accumulated depreciation (48,000) (39,000) Total assets $100,000 $119,500 Accounts payable $ 19,000 $ 12,000 Bonds payable 10,000 30,000 Common stock 50,000 61,000 Retained earnings Treasury stock Total liabilities and equity $100,000 $119,500 21,000 28,000 (11,500) Additional data for the period January 1, Year 2, through December 31, Year 2, are: 1) Sales on account, $70,000. 2) Purchases on account, $40,000. 3) Depreciation, $5,000. 4) Expenses paid in cash, $18,000 (including $4,000 of interest and $6,000 in taxes). 5) Decrease in inventory, $2,000. 6) Sales of fixed assets for $6,000 cash; cost $21,000 and two-thirds depreciated (loss or gain is included in income). 7) Purchase of fixed assets for cash, $4,000. 8) Fixed assets are exchanged for bonds payable of $30,000. 9) Sale of investments for $9,000 cash. 10) Purchase of treasury stock for cash, $11,500. 11) Retire bonds payable by issuing common stock, $10,000. 12) Collections on accounts receivable, $65,000. 13) Sold unissued common stock for cash, $1,000. Required: a) Prepare a statement of cash flows (indirect method) for the year ended December 31, Year 2. b) Prepare a side-by-side comparative statement contrasting two bases of reporting: (1) net income and (2) cash flows from operations. c) Which of the two financial reports in (b) better reflects profitability? Explain Question# 3 year is Xiomi Co. is a retailer dealing in a single product. Beginning inventory at January 1 of this zero, operating expenses for this same year are $5,000, and there are 2,000 common shares outstanding. The following purchases are made this year: Units Per Unit Cost January 100 $ 10 $ 1,000 March 300 11 3,300 June 600 12 7,200 October 300 14 4,200 December 500 15 7,500 Total 1800 23,200 Ending inventory at December 31 is 800 units. End-of-year assets, excluding inventories, amount to $75,000, of which $50,000 of the $75,000 are current. Current liabilities amount to $25,000, and long-term liabilities equal $10,000. Required: a) Determine net income for this year under each of the following inventory methods. Assume a sales price of $25 per unit and ignore income taxes. i) FIFO ii) LIFO iii) Average cost b) Compute the following ratios under each of the inventory methods of FIFO, LIFO, and average cost. i) Current ratio ii) Debt-to-equity ratio iii) Inventory turnover iv) Return on total assets v) Gross margin as a percent of sales vi) Net profit as a percent of sales c) Discuss the effects of inventory accounting methods for financial statement analysis given the results from parts a and b.
Step by Step Solution
There are 3 Steps involved in it
Step: 1

Get Instant Access to Expert-Tailored Solutions
See step-by-step solutions with expert insights and AI powered tools for academic success
Step: 2

Step: 3

Ace Your Homework with AI
Get the answers you need in no time with our AI-driven, step-by-step assistance
Get Started


