Answered step by step
Verified Expert Solution
Link Copied!

Question

1 Approved Answer

Question 1 Data for selected vegetables purchased at wholesale prices for 1995 and 2007 are shown in the following table, 1995 2007 Price Quantity Price
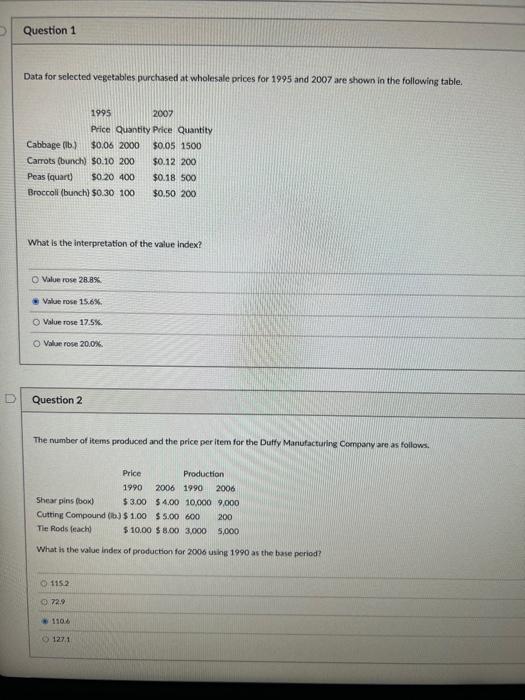
image text in transcribed
Question 1 Data for selected vegetables purchased at wholesale prices for 1995 and 2007 are shown in the following table, 1995 2007 Price Quantity Price Quantity Cabbage (ib.) $0.06 2000 $0.05 1500 Carrots (bunch $0.10 200 $0.12 200 Peas (quart) $0.20 400 $0.18 500 Broccoll (bunch) $0.30 100 $0.50 200 What is the interpretation of the value Index? O Value rose 28.8% Value rose 15.6% Value rose 17.5% O Value rose 20.0% D Question 2 The number of items produced and the price per item for the Duffy Manufacturing Comparare as follows. Price Production 1990 2006 1990 2006 Shear pins box) $ 3.00 $4.00 10.000 9000 Cutting Compound (ib.) $ 1.00 $ 5.00 600 Tie Rods each $ 10.00 $8.00 3,000 5,000 200 What is the value Index of production for 2006 using 1990 as the base period? 115 72.9 1108 1271

Step by Step Solution

There are 3 Steps involved in it

Step: 1

blur-text-image

Get Instant Access to Expert-Tailored Solutions

See step-by-step solutions with expert insights and AI powered tools for academic success

Step: 2

blur-text-image_2

Step: 3

blur-text-image_3

Ace Your Homework with AI

Get the answers you need in no time with our AI-driven, step-by-step assistance

Get Started

Recommended Textbook for

More Books

Students also viewed these Accounting questions

Question

34. Prove Theorem 9.2.1.

Answered: 1 week ago