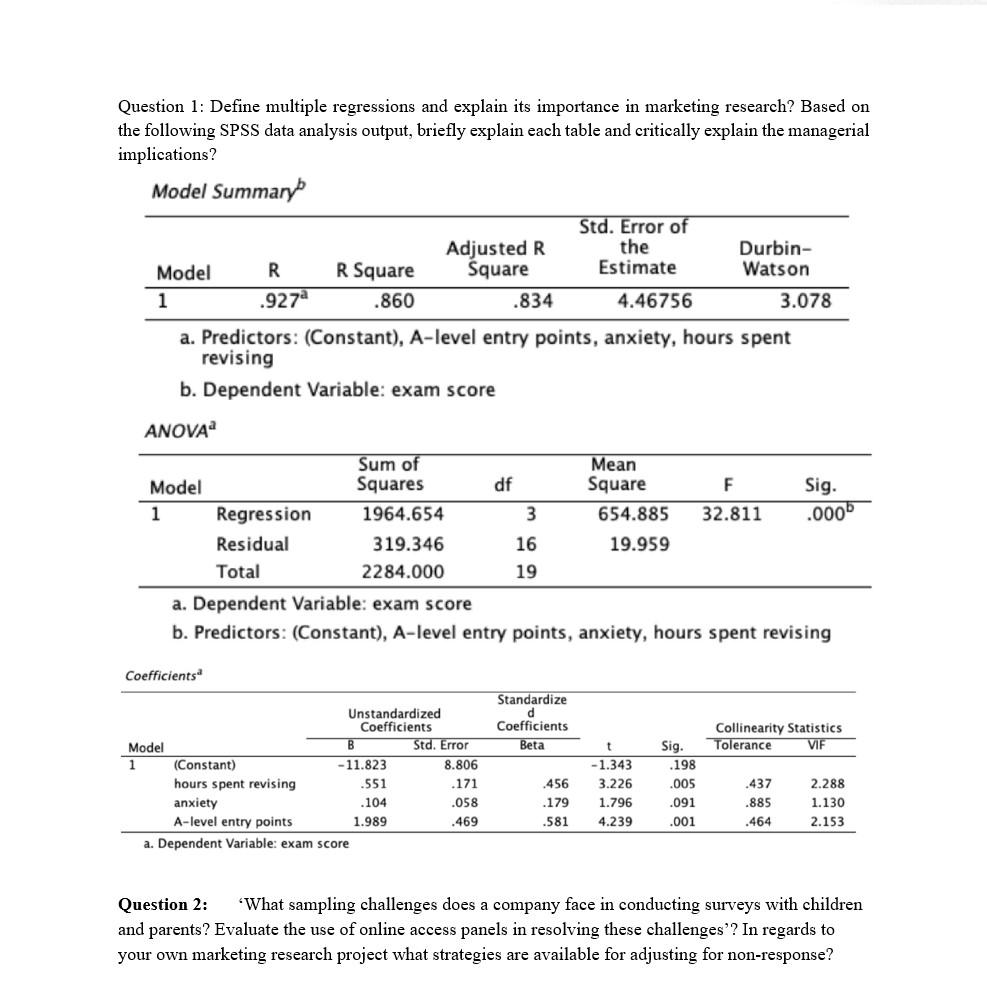
Question 1: Define multiple regressions and explain its importance in marketing research? Based on the following SPSS data analysis output, briefly explain each table and critically explain the managerial implications? Model Summary Std. Error of Adjusted R the Durbin- Model R R Square Square Estimate Watson 1 .927 .860 .834 4.46756 3.078 a. Predictors: (Constant), A-level entry points, anxiety, hours spent revising b. Dependent Variable: exam score ANOVA Sum of Mean Model Squares df Square F Sig. 1 Regression 1964.654 3 654.885 32.811 .0006 Residual 319.346 16 19.959 Total 2284.000 19 a. Dependent Variable: exam score b. Predictors: (Constant), A-level entry points, anxiety, hours spent revising Coefficients Standardize d Coefficients Beta Collinearity Statistics Tolerance VIF Unstandardized Coefficients Model B Std. Error 1 (Constant) - 11.823 8.806 hours spent revising .551 .171 anxiety .104 .058 A-level entry points 1.989 .469 a. Dependent Variable: exam score 456 .179 .581 t - 1.343 3.226 1.796 4.239 Sig. .198 .005 .091 .001 .437 .885 2.288 1.130 2.153 ,464 Question 2: What sampling challenges does a company face in conducting surveys with children and parents? Evaluate the use of online access panels in resolving these challenges'? In regards to your own marketing research project what strategies are available for adjusting for non-response? Question 1: Define multiple regressions and explain its importance in marketing research? Based on the following SPSS data analysis output, briefly explain each table and critically explain the managerial implications? Model Summary Std. Error of Adjusted R the Durbin- Model R R Square Square Estimate Watson 1 .927 .860 .834 4.46756 3.078 a. Predictors: (Constant), A-level entry points, anxiety, hours spent revising b. Dependent Variable: exam score ANOVA Sum of Mean Model Squares df Square F Sig. 1 Regression 1964.654 3 654.885 32.811 .0006 Residual 319.346 16 19.959 Total 2284.000 19 a. Dependent Variable: exam score b. Predictors: (Constant), A-level entry points, anxiety, hours spent revising Coefficients Standardize d Coefficients Beta Collinearity Statistics Tolerance VIF Unstandardized Coefficients Model B Std. Error 1 (Constant) - 11.823 8.806 hours spent revising .551 .171 anxiety .104 .058 A-level entry points 1.989 .469 a. Dependent Variable: exam score 456 .179 .581 t - 1.343 3.226 1.796 4.239 Sig. .198 .005 .091 .001 .437 .885 2.288 1.130 2.153 ,464 Question 2: What sampling challenges does a company face in conducting surveys with children and parents? Evaluate the use of online access panels in resolving these challenges'? In regards to your own marketing research project what strategies are available for adjusting for non-response


