Question 1
Does it make economic sense for Drr to enter the US market?
Question 2
If so, what would be the best offering to make?
Question 3
Would it be better to provide two different offerings? If so, what should they be?
Question 4
Which segment(s) of the customers should they target, with what selling proposition for their new offering(s)?
Develop a business case to address these issues. Assume the following: The business must generate gross revenue of $4MM/year to justify entry, and it will cost Drr an additional $3MM/year to support a second offering.
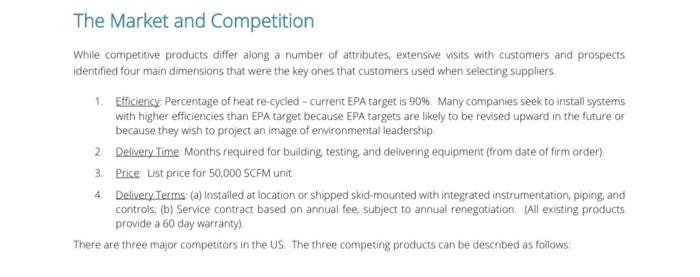
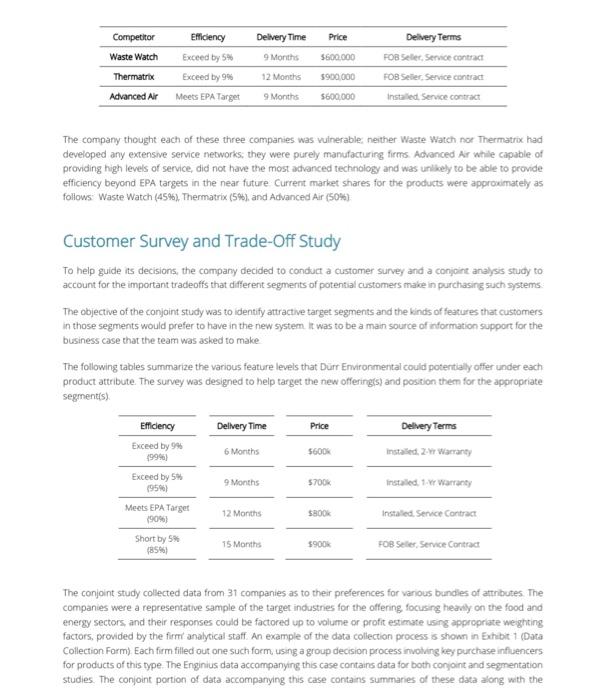
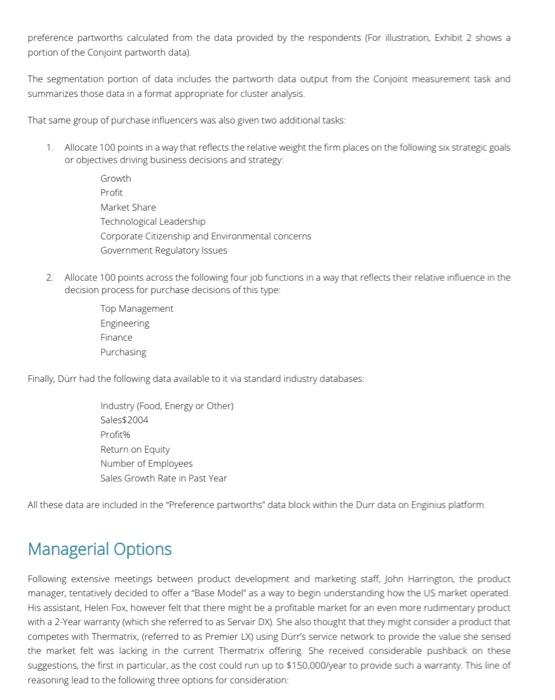
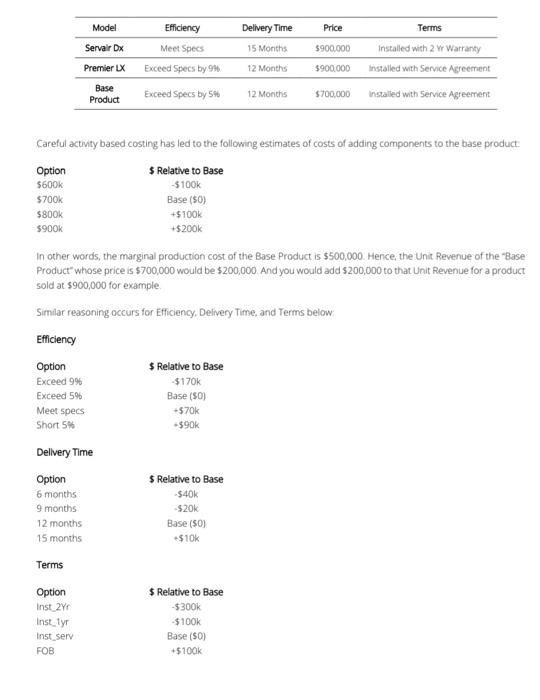
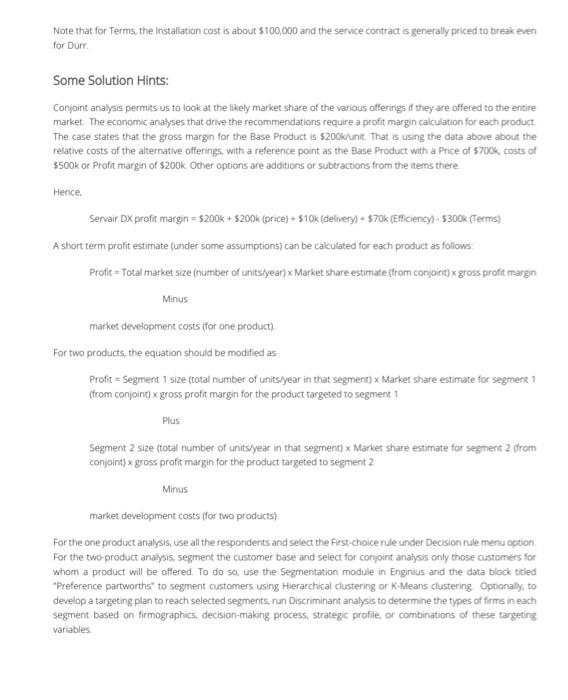
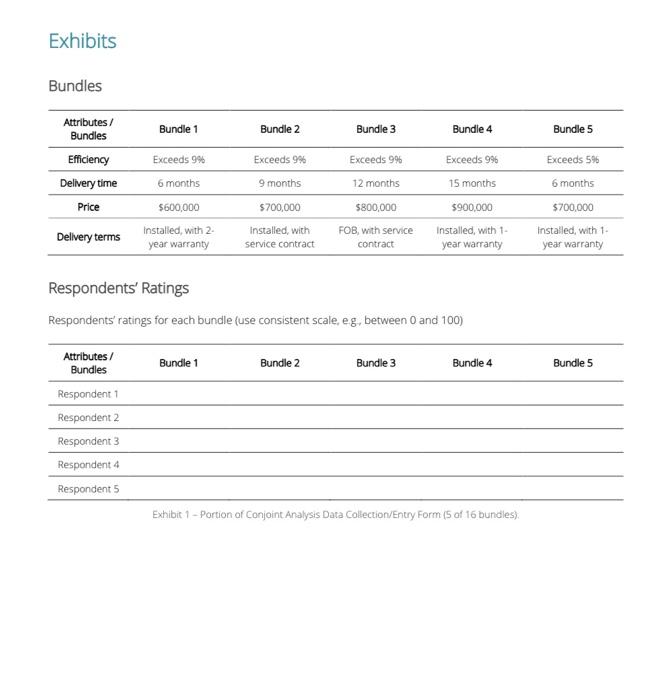
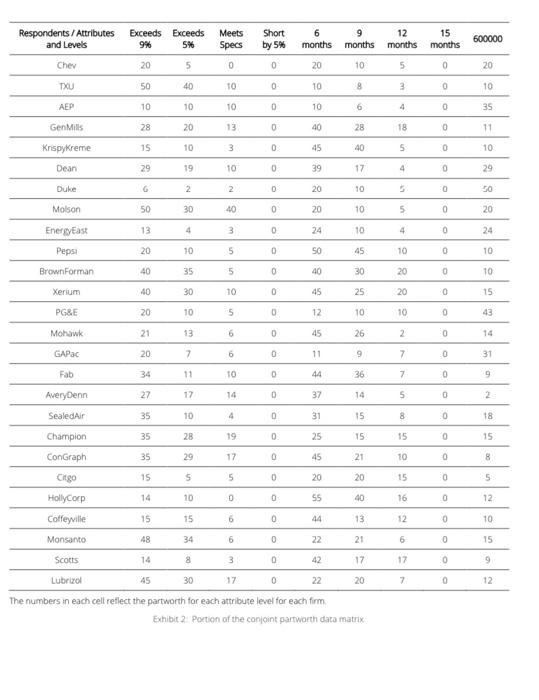
Background The Federal Clean Air Act Amendments of 1970 represent the principal source of statutory authority for controlling air pollution in the United States. In addition, a wide array of local, state, national, and international agencies has promulgated their own regulations. Because of these regulations, and general community concerns, every manufacturer has had to explore ways to reduce the pollutants that are released into the atmosphere from their factories. Volatile Organic Compounds (VOCs) and Nitrogen oxides (NOx) are among the major pollutants released into the atmosphere. Vocs are carbon-containing compounds that evaporate into the air. They contribute molecules to a complex chemical reaction with oxygen and sunlight to form ozone (O3), a major component of smog. Nitrogen Oxides are typically created during combustion processes. They are major contributors to smog formation and acid deposition problems such as acid rain A complete air emission control system for VOCs typically accomplishes three major functions: (1) filtering le. removing the particulates from the exhaust air, (2) adsorption, le concentrating the removed particulates within a small volume of air, and (3) oxidizing ie, converting the hydrocarbons into Carbon dioxide and water vapor. The oxidizing process can either be done at high temperatures (thermal oxidizers) or at lower temperatures (catalytic oxidizers). In this study, we focus on a new air emission control system with a thermal oxidizer being designed by Durr Environmental, Inc In purchasing an air emission control system, potential customers consider various factors such as maximum volume of exhaust air the system would be able to process, the flow rate, the concentration of pollutants, the efficiency of the system (how much of the heat generated is recycled), and of course, business terms such as the total cost of ownership of the system, and delivery terms. In early 2007, Drr Environmental Controls, a German conglomerate with capabilities in this arena and extensive industrial operations in the US, was considering entering the US with one or more offerings. Through other divisions, the firm had access to US distribution channels. Most importantly, through some closely related divisions, it had an extensive network of US-based service representatives who could be called upon to provide a higher level of service to their customers and prospects in this marketplace, Durr also had reason to believe that its product was less likely to need costly service than those of competitors. In fact, some of its product development engineers and managers had been urging Drr to consider a warranty of up to two years. However, the company had no current understanding of how much customers would be willing to pay for such a warranty (50 days was industry standard) In addition, some new technical developments in Germany permitted Drr to credibly offer a system that exceeded EPA targets by up to 9%. The most popular size and capacity for such systems is 50,000 SCFM (Standardi Cubic Feet per Minute), a size targeted to the larger manufacturers, and was a basic design decision across the offerings. Market research indicated that there would be about 300 units of that size sold in the US each year over the next decade Volatile Organic Compounds (VOCs) and Nitrogen oxides (NOx) are among the major pollutants released into the atmosphere. VOCs are carbon-containing compounds that evaporate into the air. They contribute molecules to a complex chemical reaction with oxygen and sunlight to form ozone (03), a major component of smog. Nitrogen Oxides The Market and Competition While competitive products differ along a number of attributes, extensive visits with customers and prospects identified four main dimensions that were the key ones that customers used when selecting suppliers 1. Efficiency Percentage of heat re-cycled - current EPA target is 90%. Many companies seek to install systems with higher efficiencies than EPA target because EPA targets are likely to be revised upward in the future or because they wish to project an image of environmental leadership 2. Delivery Time Months required for building testing and delivering equipment (from date of firm order) 3. Price List price for 50,000 SCFM unit 4. Delivery Terms: (a) Installed at location or shipped skid-mounted with integrated instrumentation, piping, and controls; (b) Service contract based on annual fee, subject to annual renegotiation (All existing products provide a 60 day warranty) There are three major competitors in the US. The three competing products can be described as follows Competitor Efficiency Delivery Time Price Waste Watch Exceed by 5% $600.000 Delivery Terms FOB Seler Service contract FOB Seller Service contract Installed Service contract Thermatrix Advanced Air 9 Months 12 Months 9 Months Exceed by 99 Meets EPA Target 5900.000 $600,000 The company thought each of these three companies was vulnerable: neither Waste Watch not Thermatrix had developed any extensive service networks, they were purely manufacturing firms. Advanced Ar while capable of providing high levels of service, did not have the most advanced technology and was unlikely to be able to provide efficiency beyond EPA targets in the near future Current market shares for the products were approximately as follows Waste Watch (45%), Thermatrix (5%), and Advanced Air (50%) Customer Survey and Trade-Off Study To help guide its decisions, the company decided to conduct a customer survey and a conjoint analysis study to account for the important tradeoffs that different segments of potential customers make in purchasing such systems The objective of the conjoint study was to identify attractive target segments and the kinds of features that customers in those segments would prefer to have in the new system. It was to be a man source of information support for the business case that the team was asked to make The following tables summarize the various feature levels that Drr Environmental could potentially offer under each product attribute. The survey was designed to help target the new offerings) and position them for the appropriate segment(s) Delivery Time Price Efficiency Exceed by 9% 1999) Exceed by 5 (95) Delivery Terms Installed, 2-wr Warranty 6 Months $600K 9 Months $700K installed. 1. Warranty Meets EPA Target (90%) 12 Months $800K Installed Service Contract Short by 5% (85%) 15 Months 59002 FOB Seler, Service Contract The conjoint study collected data from 31 companies as to their preferences for various bundies of attributes The companies were a representative sample of the target industries for the offering focusing heavily on the food and energy sectors, and their responses could be factored up to volume or profit estimate using appropriate weighting factors, provided by the firm analytical staff. An example of the data collection process is shown in Exhibit 1 (Data Collection Form) Each firm filled out one such form, using a group decision process involving key purchase influencers for products of this type The Enginius data accompanying this case contains data for both conjoint and segmentation studies. The conjoint portion of data accompanying this case contains summaries of these data along with the preference partworths calculated from the data provided by the respondents (For illustration Exhibit 2 shows a portion of the Conjoint partworth data). The segmentation portion of data includes the partworth data output from the Conjoint measurement task and summarizes those data in a format appropriate for cluster analysis That same group of purchase influencers was also given two additional tasks 1. Allocate 100 points in a way that reflects the relative weight the firm places on the following six strategic goals or objectives driving business decisions and strategy Growth Profit Market Share Technological Leadership Corporate Citizenship and Environmental concerns Government Regulatory issues 2. Allocate 100 points across the following four job functions in a way that reflects their relative influence in the decision process for purchase decisions of this type: Top Management Engineering Finance Purchasing Finally. Durr had the following data available to it via standard industry databases: Industry (Food, Energy or Other) Sales 2004 Profit Return on Equity Number of Employees Sales Growth Rate in Past Year All these data are included in the Preference partworths data block within the Durr data an Enginluis platform Managerial Options Following extensive meetings between product development and marketing staff, John Harrington the product manager, tentatively decided to offer a 'Base Model as a way to begin understanding how the US market operated His assistant, Helen Fox, however felt that there might be a profitable market for an even more rudimentary product with a 2-Year Warranty (which she referred to as Servair DX). She also thought that they might consider a product that competes with Thermatrix, (referred to as Premier LX) using Durr's service network to provide the value she sensed the market felt was lacking in the current Thermatrix offering She received considerable pushback on these suggestions, the first in particular, as the cost could run up to $150,000/year to provide such a warranty. This line of reasoning lead to the following three options for consideration Model Efficiency Delivery Time Price Terms Servair Dx Meet Specs 15 Months $900.000 Exceed Specs by 99 12 Months $900.000 Premier LX Base Product Installed with 2 w Warranty Installed with Service Agreement Installed with Service Agreement Exceed Specs by 5% 12 Months $700,000 Careful activity based costing has led to the following estimates of costs of adding components to the base product: Option $ Relative to Base $600K -5100k Base (50) $700K $800K 5900K +$100K +$200K In other words, the marginal production cost of the Base Product is $500,000. Hence, the Unit Revenue of the Base Product" whose price is $700,000 would be $200,000. And you would add $200,000 to that Unit Revenue for a product sold at $900,000 for example Similar reasoning occurs for Efficiency, Delivery Time, and Terms below Efficiency Option $ Relative to Base Exceed 9% -$170k Exceed 5% Base (50) Meet specs +570k Short 5% 590k Delivery Time Option $ Relative to Base 6 months 340k 9 months $20k 12 months Base (50) 15 months +$10k Terms Option Inst 21 Inst_tyr Inst_serv FOB $ Relative to Base -5300k $100k Base (50) +$100k Note that for Terms, the Installation cost is about $100,000 and the service contract is generally priced to break even for Durr Some Solution Hints: Conjoint analysis permits us to look at the likely market share of the various offerings if they are offered to the entire market. The economic analyses that drive the recommendations require a profit margin calculation for each product. The case states that the gross margin for the Base Product is $200k/unit. That is using the data above about the relative costs of the alternative offerings, with a reference point as the Base Product with a Price of 5700k costs of $500k or Profit margin of $200k Other options are additions or subtractions from the items there Hence, Servair DX profit margin = $200k + $200 (price) + $10k (delivery) + $70k (Efficiency) - $300K (Terms) A short term profit estimate (under some assumptions) can be calculated for each product as follows Profit= Total market size (number of units/year) x Market share estimate (from conjoint) x gross profit margin Minus market development costs (for one product) For two products, the equation should be modified as Profit = Segment size (total number of units/year in that segment) x Market share estimate for segment 1 (from conjoint) x gross profit margin for the product targeted to segment 1 Plus Segment 2 size (total number of units/year in that segment) x Market share estimate for segment 2 (from conjoint) x gross profit margin for the product targeted to segment 2 Minus market development costs (for two products) For the one product analysis, use all the respondents and select the First choice rule under Decision rule menu option For the two-product analysis, segment the customer base and select for conjoint analysis only those customers for whom a product will be offered to do so, use the Segmentation module in Enginius and the data block titled "Preference partworths to segment customers using Hierarchical clustering or K-Means clustering Optionally, to develop a targeting plan to reach selected segments, run Discriminant analysis to determine the types of firms in each segment based on firmographics, decision-making process, strategic profile, or combinations of these targeting variables Exhibits Bundles Bundle 1 Bundle 2 Bundle 3 Bundle 4 Bundle 5 Attributes / Bundles Efficiency Delivery time Price Exceeds 99 6 months $600,000 Installed, with 2 year warranty Exceeds 9% 9 months $700,000 Installed, with service contract Exceeds 9% 12 months $800,000 FOB, with service contract Exceeds 996 15 months 5900.000 Exceeds 5% 6 months $700,000 Installed, with 1 year warranty Delivery terms Installed, with 1 year warranty Respondents' Ratings Respondents' ratings for each bundle (use consistent scale, eg, between 0 and 100) Bundle 1 Bundle 2 Bundle 3 Bundle 4 Bundle 5 Attributes / Bundles Respondent 1 Respondent 2 Respondent 3 Respondent 4 Respondents Exhibit 1 - Portion of Conjoint. Analysis Data Collection/Entry Form (5 of 16 bundles). Respondents / Attributes and Levels Exceeds Exceeds 9% 5% Meets Specs Short by 5% 6 months 9 months 12 15 months months 600000 Chev 20 5 0 20 10 5 0 20 TXU 50 40 10 10 8 2 0 10 AEP 10 10 10 10 6 0 35 Gen Mills 28 20 13 ooooooo 40 28 18 0 11 Krispy Kreme 15 10 3 45 40 5 0 10 Dean 29 19 10 39 17 4 0 29 Duke 2 2 20 10 0 50 Molson 50 30 40 0 20 10 5 0 20 EnergyEast 13 4 0 24 10 4 0 24 GIRL ALL Pepsi 20 10 5 0 SO 45 10 0 10 Brown Forman 40 35 40 30 20 0 10 Xerium 40 30 10 45 25 20 0 15 PG&E 20 10 12 10 10 0 43 Mohawk 21 13 6 45 26 2 0 14 GAPac 20 7 6 11 9 7 0 31 Fab 34 11 TO 44 36 7 0 9 Avery Denn 27 17 14 37 14 5 0 2 OOOOO OOOOOOOOOOOO SealedAir 35 10 4 31 15 8 0 18 35 28 19 25 15 15 0 15 Champion ConGraph 35 29 17 45 21 10 0 8 Citgo 15 5 5 20 20 15 0 5 14 10 0 0 55 40 16 0 12 HollyCorp Coffeyville 15 15 0 44 13 12 0 10 Monsanto 48 34 22 21 6 0 15 Scotts 14 . 3 42 17 17 0 9 45 30 17 7 0 12 Lubrzo 22 20 The numbers in each cell reflect the partworth for each attribute level for each firm. Exhibit 2 portion of the conjoint partworth data matrix