Answered step by step
Verified Expert Solution
Question
1 Approved Answer
Question 1 In a competitive business environment, especially in the case of a mature market, offering high-level quality services is essential for mobile phone network
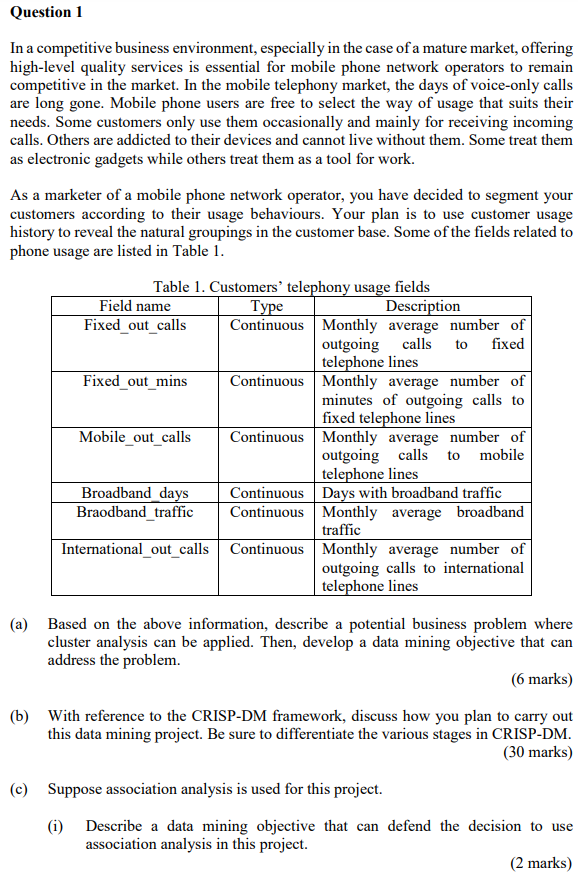


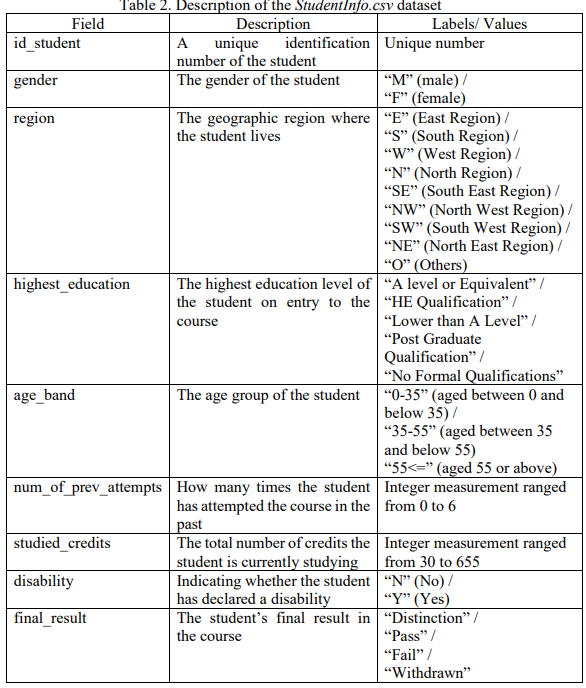

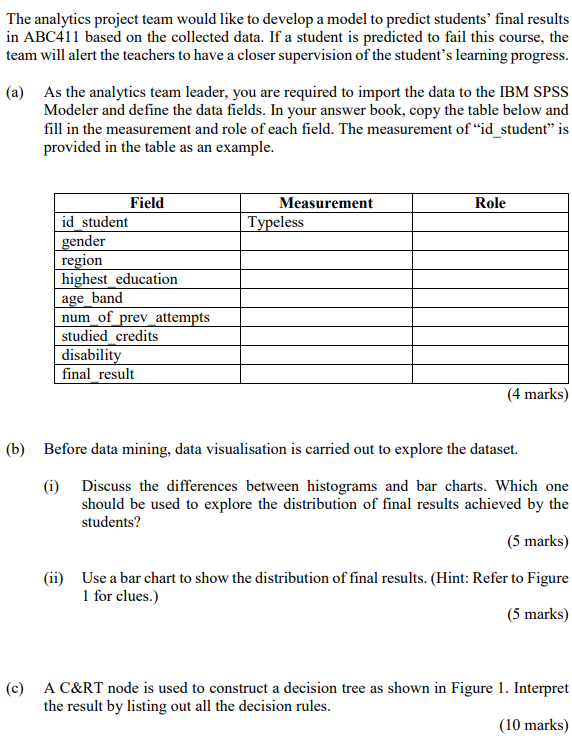
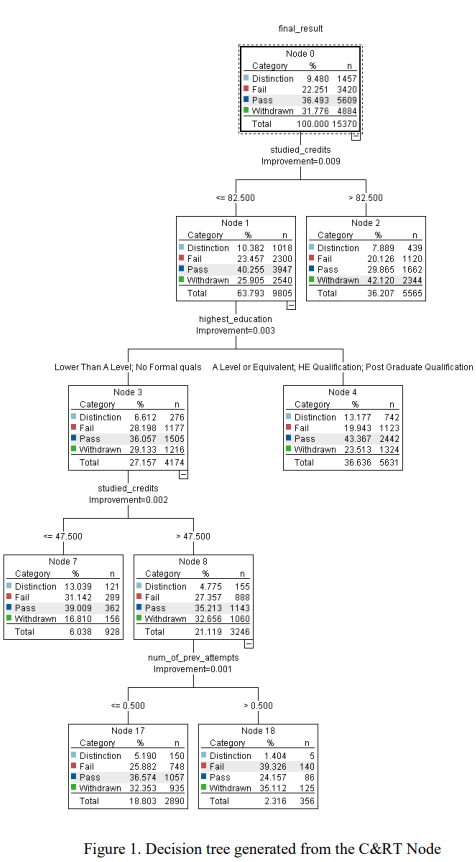
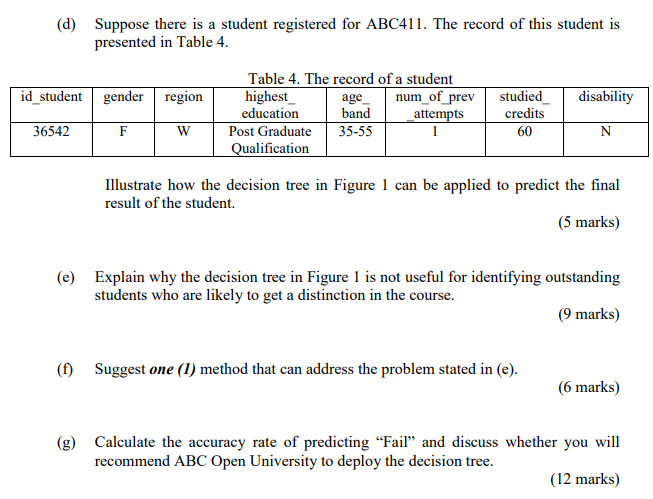
Question 1 In a competitive business environment, especially in the case of a mature market, offering high-level quality services is essential for mobile phone network operators to remain competitive in the market. In the mobile telephony market, the days of voice-only calls are long gone. Mobile phone users are free to select the way of usage that suits their needs. Some customers only use them occasionally and mainly for receiving incoming calls. Others are addicted to their devices and cannot live without them. Some treat them as electronic gadgets while others treat them as a tool for work. As a marketer of a mobile phone network operator, you have decided to segment your customers according to their usage behaviours. Your plan is to use customer usage history to reveal the natural groupings in the customer base. Some of the fields related to phone usage are listed in Table 1. Tahle 1 Cistomers' telenhonv ucaoe fields (a) Based on the above information, describe a potential business problem where cluster analysis can be applied. Then, develop a data mining objective that can address the problem. (6 marks) (b) With reference to the CRISP-DM framework, discuss how you plan to carry out this data mining project. Be sure to differentiate the various stages in CRISP-DM. (30 marks) (c) Suppose association analysis is used for this project. (i) Describe a data mining objective that can defend the decision to use association analysis in this project. (2 marks) (ii) Is there any data preparation needed before applying association analysis? Take one (1) field from Table 1 as an example to explain how to prepare the data. (6 marks) ABC Open University has a Teaching and Learning Analytics Unit (TLAU) which aims to provide information for data-driven and evidence-based decision making in both teaching and learning in the university. One of the current projects in TLAU is to analyse student data and give advice on how to improve students' learning performance. The analytics team for this project has collected over 10,000 records of students who have completed a compulsory course ABC411 from 2014 to 2019. The description of the dataset (StudentInfo.csv) is presented in Table 2 while some sample records are listed in Table 3 Table 2. Description of the Studentlnfo.csv dataset Table 3. Sample records in the StudentInfo.csv dataset The analytics project team would like to develop a model to predict students' final results in ABC411 based on the collected data. If a student is predicted to fail this course, the team will alert the teachers to have a closer supervision of the student's learning progress. (a) As the analytics team leader, you are required to import the data to the IBM SPSS Modeler and define the data fields. In your answer book, copy the table below and fill in the measurement and role of each field. The measurement of "id student" is provided in the table as an example. (b) Before data mining, data visualisation is carried out to explore the dataset. (i) Discuss the differences between histograms and bar charts. Which one should be used to explore the distribution of final results achieved by the students? (5 marks) (ii) Use a bar chart to show the distribution of final results. (Hint: Refer to Figure 1 for clues.) (5 marks) (c) A C\&RT node is used to construct a decision tree as shown in Figure 1. Interpret the result by listing out all the decision rules. (10 marks) Figure 1. Decision tree generated from the C\&RT Node (d) Suppose there is a student registered for ABC411. The record of this student is presented in Table 4. Tohlo A The rosond of o etindent Illustrate how the decision tree in Figure 1 can be applied to predict the final result of the student. (5 marks) (e) Explain why the decision tree in Figure 1 is not useful for identifying outstanding students who are likely to get a distinction in the course. (9marks) (f) Suggest one (1) method that can address the problem stated in (e). (6marks) (g) Calculate the accuracy rate of predicting "Fail" and discuss whether you will recommend ABC Open University to deploy the decision tree. (12 marks) Question 1 In a competitive business environment, especially in the case of a mature market, offering high-level quality services is essential for mobile phone network operators to remain competitive in the market. In the mobile telephony market, the days of voice-only calls are long gone. Mobile phone users are free to select the way of usage that suits their needs. Some customers only use them occasionally and mainly for receiving incoming calls. Others are addicted to their devices and cannot live without them. Some treat them as electronic gadgets while others treat them as a tool for work. As a marketer of a mobile phone network operator, you have decided to segment your customers according to their usage behaviours. Your plan is to use customer usage history to reveal the natural groupings in the customer base. Some of the fields related to phone usage are listed in Table 1. Tahle 1 Cistomers' telenhonv ucaoe fields (a) Based on the above information, describe a potential business problem where cluster analysis can be applied. Then, develop a data mining objective that can address the problem. (6 marks) (b) With reference to the CRISP-DM framework, discuss how you plan to carry out this data mining project. Be sure to differentiate the various stages in CRISP-DM. (30 marks) (c) Suppose association analysis is used for this project. (i) Describe a data mining objective that can defend the decision to use association analysis in this project. (2 marks) (ii) Is there any data preparation needed before applying association analysis? Take one (1) field from Table 1 as an example to explain how to prepare the data. (6 marks) ABC Open University has a Teaching and Learning Analytics Unit (TLAU) which aims to provide information for data-driven and evidence-based decision making in both teaching and learning in the university. One of the current projects in TLAU is to analyse student data and give advice on how to improve students' learning performance. The analytics team for this project has collected over 10,000 records of students who have completed a compulsory course ABC411 from 2014 to 2019. The description of the dataset (StudentInfo.csv) is presented in Table 2 while some sample records are listed in Table 3 Table 2. Description of the Studentlnfo.csv dataset Table 3. Sample records in the StudentInfo.csv dataset The analytics project team would like to develop a model to predict students' final results in ABC411 based on the collected data. If a student is predicted to fail this course, the team will alert the teachers to have a closer supervision of the student's learning progress. (a) As the analytics team leader, you are required to import the data to the IBM SPSS Modeler and define the data fields. In your answer book, copy the table below and fill in the measurement and role of each field. The measurement of "id student" is provided in the table as an example. (b) Before data mining, data visualisation is carried out to explore the dataset. (i) Discuss the differences between histograms and bar charts. Which one should be used to explore the distribution of final results achieved by the students? (5 marks) (ii) Use a bar chart to show the distribution of final results. (Hint: Refer to Figure 1 for clues.) (5 marks) (c) A C\&RT node is used to construct a decision tree as shown in Figure 1. Interpret the result by listing out all the decision rules. (10 marks) Figure 1. Decision tree generated from the C\&RT Node (d) Suppose there is a student registered for ABC411. The record of this student is presented in Table 4. Tohlo A The rosond of o etindent Illustrate how the decision tree in Figure 1 can be applied to predict the final result of the student. (5 marks) (e) Explain why the decision tree in Figure 1 is not useful for identifying outstanding students who are likely to get a distinction in the course. (9marks) (f) Suggest one (1) method that can address the problem stated in (e). (6marks) (g) Calculate the accuracy rate of predicting "Fail" and discuss whether you will recommend ABC Open University to deploy the decision tree. (12 marks)
Step by Step Solution
There are 3 Steps involved in it
Step: 1

Get Instant Access to Expert-Tailored Solutions
See step-by-step solutions with expert insights and AI powered tools for academic success
Step: 2

Step: 3

Ace Your Homework with AI
Get the answers you need in no time with our AI-driven, step-by-step assistance
Get Started


