Answered step by step
Verified Expert Solution
Question
1 Approved Answer
Question 1 In an experiment to study 3 genetic modifications of a plant, 3 wild plants formed a control group. The groups of genetically modified
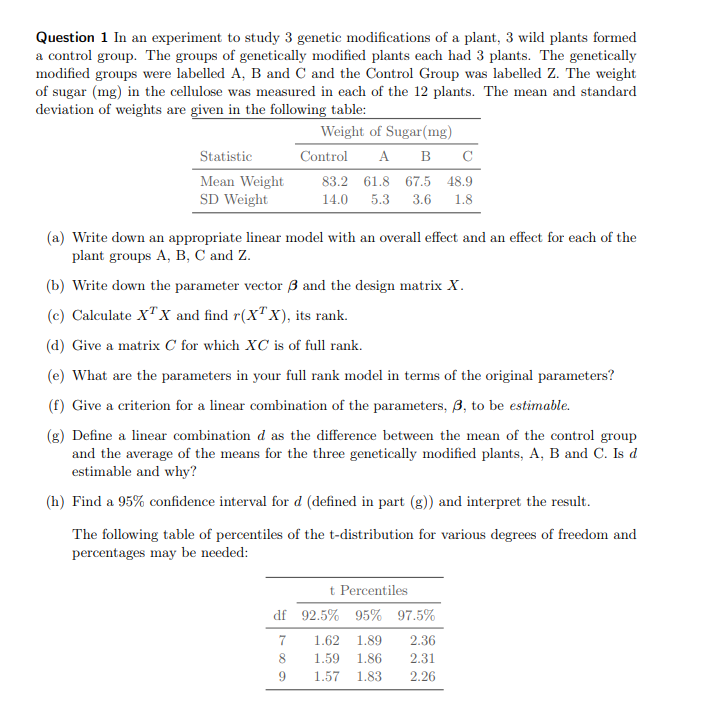
Question 1 In an experiment to study 3 genetic modifications of a plant, 3 wild plants formed a control group. The groups of genetically modified plants each had 3 plants. The genetically modified groups were labelled A. B and C and the Control Group was labelled Z. The weight of sugar (mg) in the cellulose was measured in each of the 12 plants. The mean and standard deviation of weights are given in the following table: Weight of Sugar(mg) Statistic Control A B C Mean Weight 83.2 61.8 67.5 48.9 SD Weight 14.0 5.3 3.6 1.8 (a) Write down an appropriate linear model with an overall effect and an effect for each of the plant groups A, B, C and Z. (b) Write down the parameter vector B and the design matrix X. (c) Calculate X X and find r(XX), its rank. (d) Give a matrix C for which XC is of full rank. e) What are the parameters in your full rank model in terms of the original parameters? (f) Give a criterion for a linear combination of the parameters, B, to be estimable. (g) Define a linear combination d as the difference between the mean of the control group and the average of the means for the three genetically modified plants, A, B and C. Is d estimable and why? (h) Find a 95% confidence interval for d (defined in part (g)) and interpret the result. The following table of percentiles of the t-distribution for various degrees of freedom and percentages may be needed: t Percentiles df 92.5% 95% 97.5% 1.62 1.89 2.36 1.59 1.86 2.31 1.57 1.83 2.26
Step by Step Solution
There are 3 Steps involved in it
Step: 1
Get Instant Access to Expert-Tailored Solutions
See step-by-step solutions with expert insights and AI powered tools for academic success
Step: 2
Step: 3
Ace Your Homework with AI
Get the answers you need in no time with our AI-driven, step-by-step assistance
Get Started