Question 1:
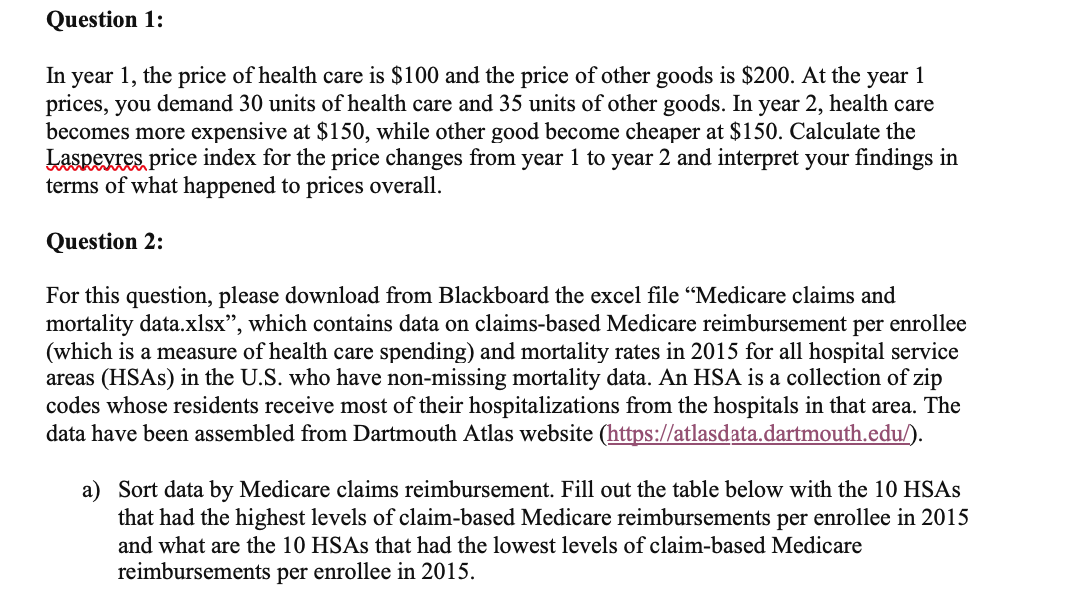
In year 1, the price of health care is $100 and the price of other goods is $200. At the year 1 prices, you demand 30 units of health care and 35 units of other goods. In year 2, health care becomes more expensive at $150, while other good become cheaper at $150. Calculate the Laspeyres price index for the price changes from year 1 to year 2 and interpret your findings in terms of what happened to prices overall.
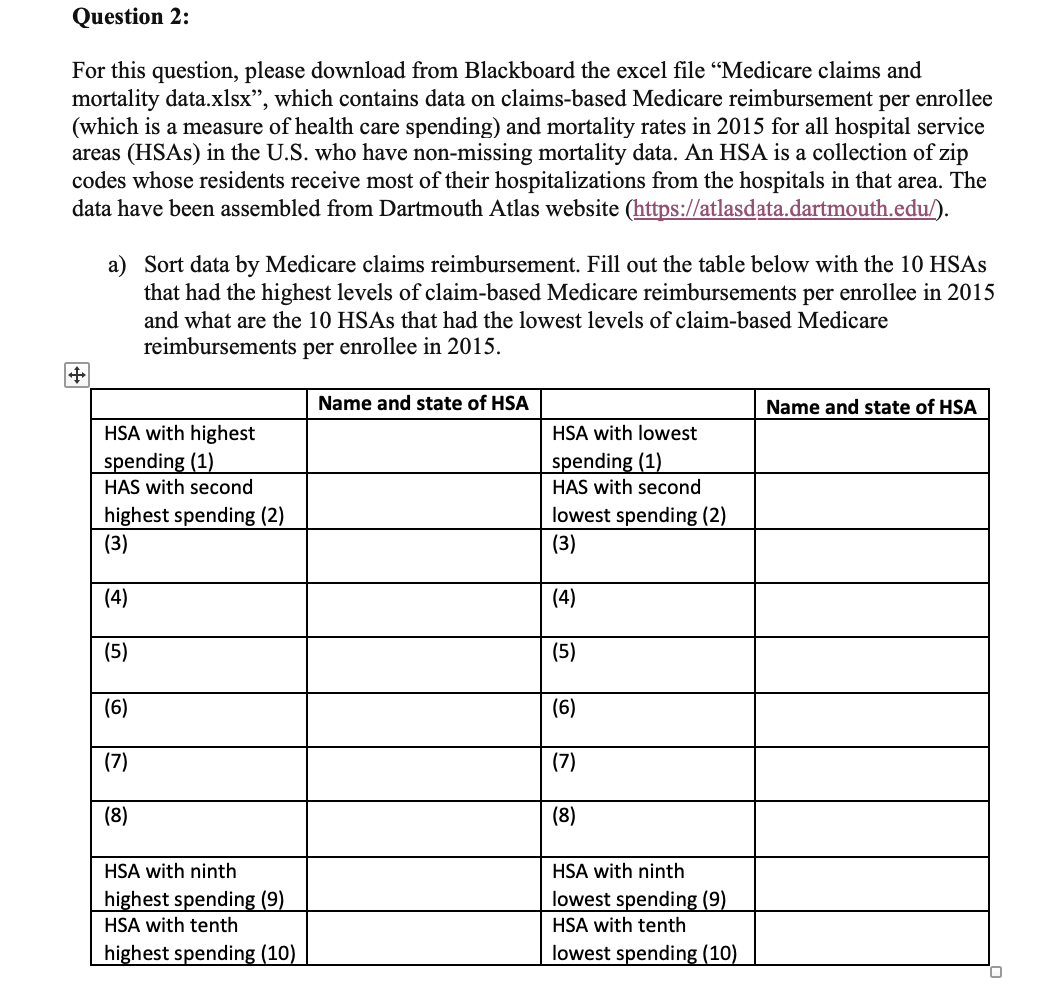
Name and state of HSA
Name and state of HSA
HSA with highest spending (1)
HSA with lowest spending (1)
HAS with second highest spending (2)
HAS with second lowest spending (2)
(3)
(3)
(4)
(4)
(5)
(5)
(6)
(6)
(7)
(7)
(8)
(8)
HSA with ninth highest spending (9)
HSA with ninth lowest spending (9)
HSA with tenth highest spending (10)
HSA with tenth lowest spending (10)
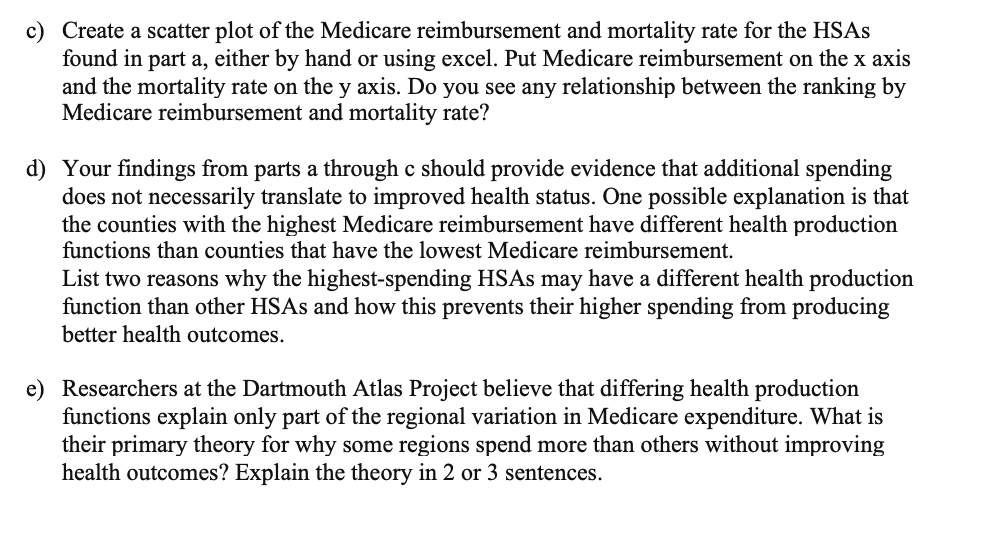
D)Your findings from parts a through c should provide evidence that additional spending does not necessarily translate to improved health status. One possible explanation is that the counties with the highest Medicare reimbursement have different health production functions than counties that have the lowest Medicare reimbursement.
List two reasons why the highest-spending HSAs may have a different health production function than other HSAs and how this prevents their higher spending from producing better health outcomes.
E)Researchers at the Dartmouth Atlas Project believe that differing health production functions explain only part of the regional variation in Medicare expenditure. What is their primary theory for why some regions spend more than others without improving health outcomes? Explain the theory
https://atlasdata.dartmouth.edu/
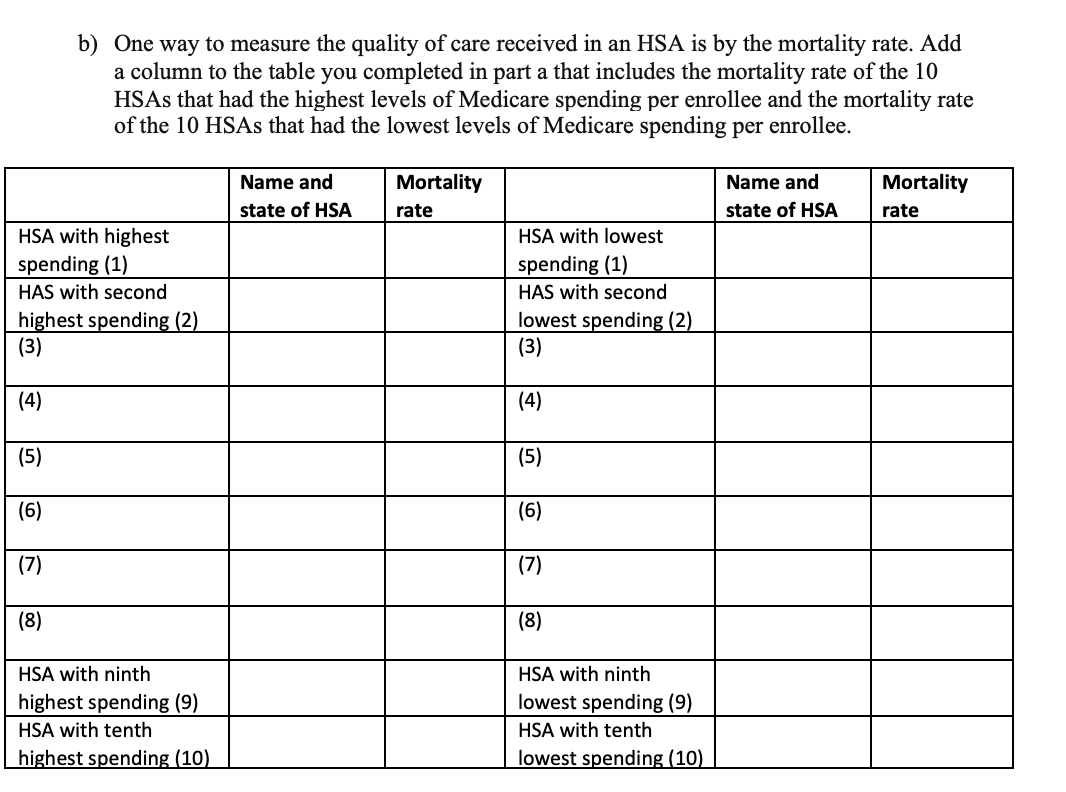
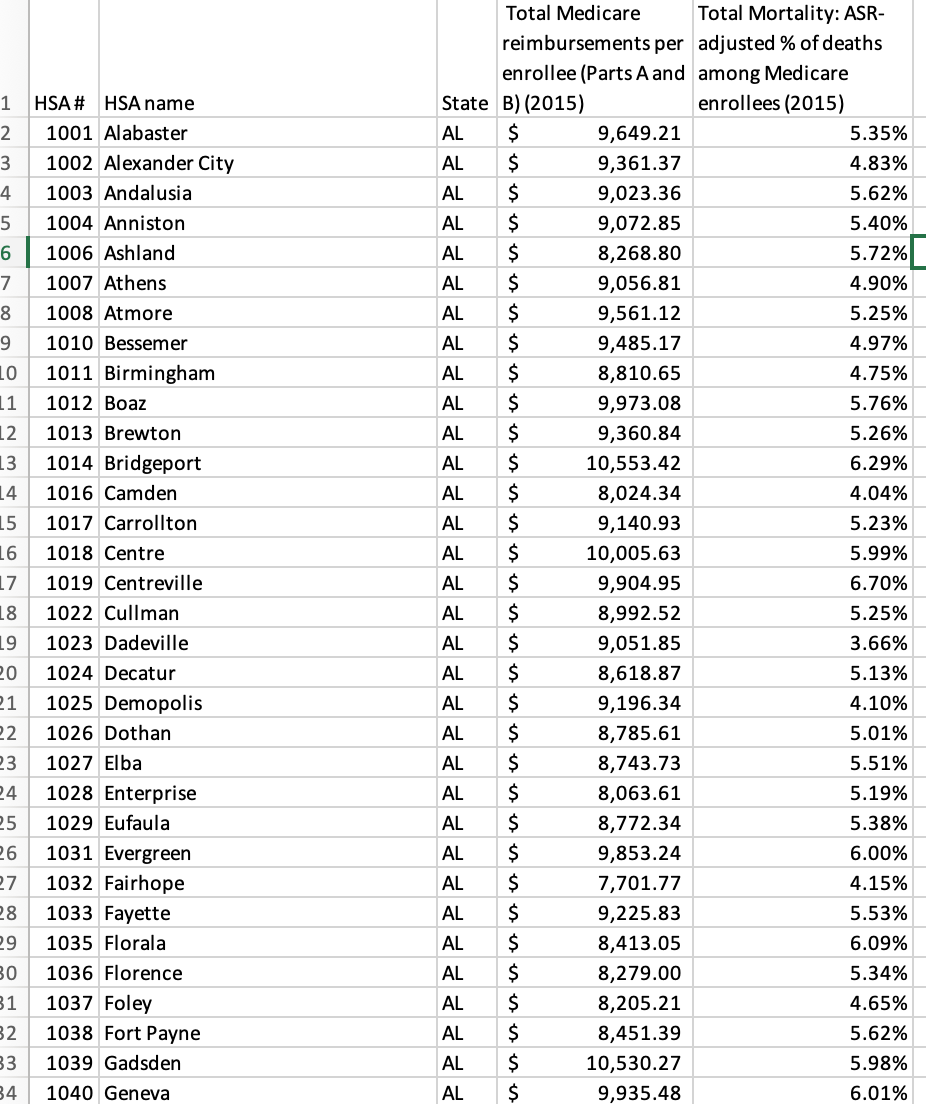
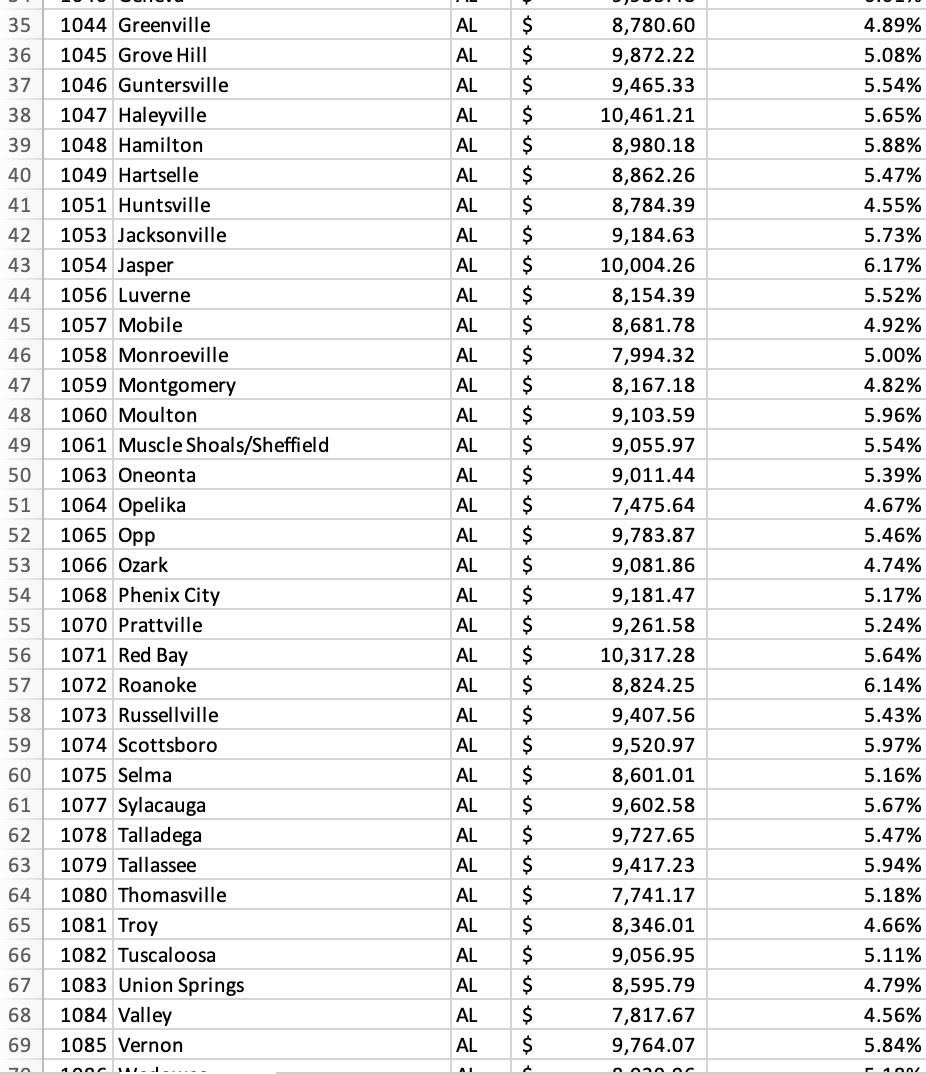
b) One way to measure the quality of care received in an HSA is by the mortality rate. Add a column to the table you completed in part a that includes the mortality rate of the 10 HSAs that had the highest levels of Medicare spending per enrollee and the mortality rate of the 10 HSAs that had the lowest levels of Medicare spending per enrollee. Name and Mortality Name and Mortality state of HSA rate state of HSA rate HSA with highest HSA with lowest spending (1) spending (1) HAS with second HAS with second highest spending (2) lowest spending (2) (3) (3) (4) (4) (5) (5) (6) (6) (7) (7) (8) (8) HSA with ninth HSA with ninth highest spending (9) lowest spending (9) HSA with tenth HSA with tenth highest spending (10) lowest spending (10)c) Create a scatter plot of the Medicare reimbursement and mortality rate for the HSAs found in part a, either by hand or using excel. Put Medicare reimbursement on the x axis and the mortality rate on the y axis. Do you see any relationship between the ranking by Medicare reimbursement and mortality rate? d) Your ndings from parts a through c should provide evidence that additional spending does not necessarily translate to improved health status. One possible explanation is that the counties with the highest Medicare reimbursement have different health production mctions than counties that have the lowest Medicare reimbursement. List two reasons why the highest-spending HSAs may have a different health production mction than other HSAs and how this prevents their higher spending from producing better health outcomes. e) Researchers at the Dartmouth Atlas Project believe that differing health production mctions explain only part of the regional variation in Medicare expenditure. What is their primary theory for why some regions spend more than others without improving health outcomes? Explain the theory in 2 or 3 sentences. \f\fQuestion 1: In year 1, the price of health care is $100 and the price of other goods is $200. At the year 1 prices, you demand 30 units of health care and 35 units of other goods. In year 2, health care becomes more expensive at $150, while other good become cheaper at $150. Calculate the Wpce index for the price changes from year 1 to year 2 and interpret your ndings in terms of what happened to prices overall. Question 2: For this question, please download from Blackboard the excel le \"Medicare claims and mortality data.xlsx\Question 2: For this question, please download from Blackboard the excel file "Medicare claims and mortality data.xlsx", which contains data on claims-based Medicare reimbursement per enrollee (which is a measure of health care spending) and mortality rates in 2015 for all hospital service areas (HSAs) in the U.S. who have non-missing mortality data. An HSA is a collection of zip codes whose residents receive most of their hospitalizations from the hospitals in that area. The data have been assembled from Dartmouth Atlas website (https://atlasdata.dartmouth.edu/). a) Sort data by Medicare claims reimbursement. Fill out the table below with the 10 HSAs that had the highest levels of claim-based Medicare reimbursements per enrollee in 2015 and what are the 10 HSAs that had the lowest levels of claim-based Medicare reimbursements per enrollee in 2015. Name and state of HSA Name and state of HSA HSA with highest HSA with lowest spending (1) spending (1) HAS with second HAS with second highest spending (2) lowest spending (2) (3) (3) (4) (4) (5) (5) (6) (6) (7) (7) (8) (8) HSA with ninth HSA with ninth highest spending (9 lowest spending (9) HSA with tenth HSA with tenth highest spending (10) lowest spending