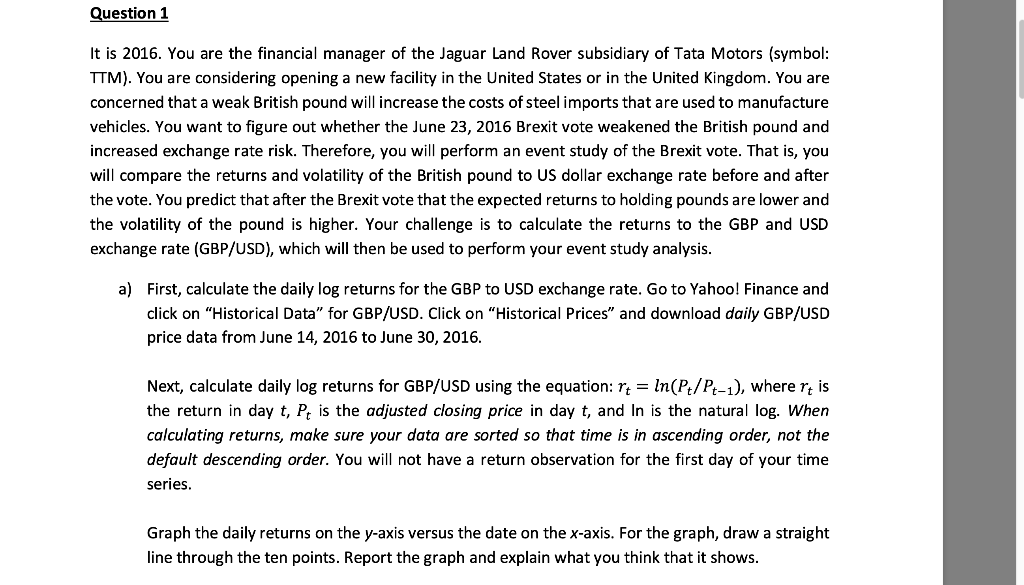
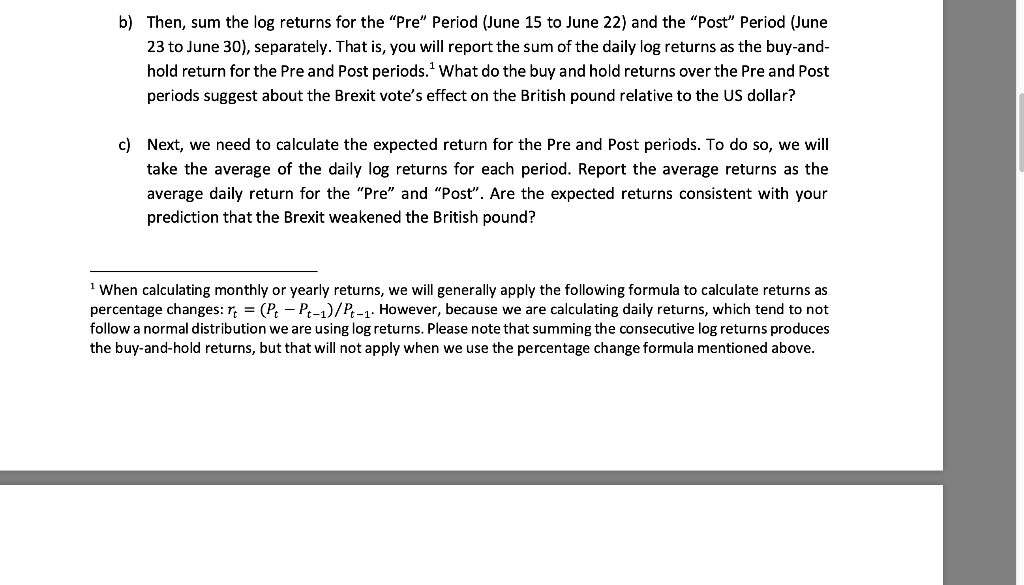
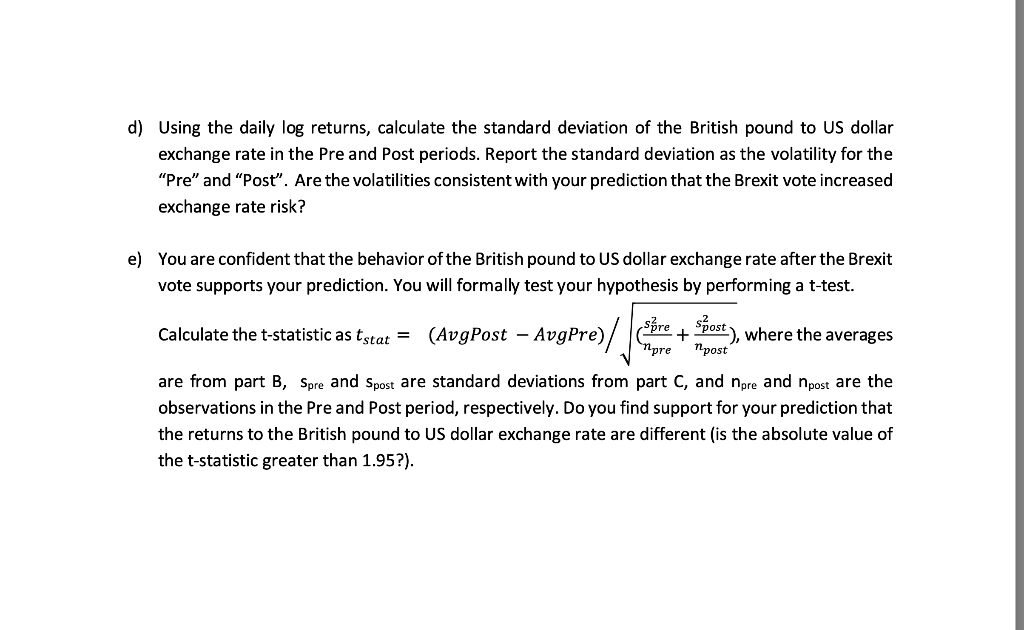
Question 1 It is 2016. You are the financial manager of the Jaguar Land Rover subsidiary of Tata Motors (symbol: TTM). You are considering opening a new facility in the United States or in the United Kingdom. You are concerned that a weak British pound will increase the costs of steel imports that are used to manufacture vehicles. You want to figure out whether the June 23, 2016 Brexit vote weakened the British pound and increased exchange rate risk. Therefore, you will perform an event study of the Brexit vote. That is, you will compare the returns and volatility of the British pound to US dollar exchange rate before and after the vote. You predict that after the Brexit vote that the expected returns to holding pounds are lower and the volatility of the pound is higher. Your challenge is to calculate the returns to the GBP and USD exchange rate (GBP/USD), which will then be used to perform your event study analysis. a) First, calculate the daily log returns for the GBP to USD exchange rate. Go to Yahoo! Finance and click on "Historical Data" for GBP/USD. Click on "Historical Prices" and download daily GBP/USD price data from June 14, 2016 to June 30, 2016. Next, calculate daily log returns for GBP/USD using the equation: rt = ln(Pt/Pt-1), where rt is the return in day t, Pt is the adjusted closing price in day t, and in is the natural log. When calculating returns, make sure your data are sorted so that time is in ascending order, not the default descending order. You will not have a return observation for the first day of your time series. Graph the daily returns on the y-axis versus the date on the x-axis. For the graph, draw a straight line through the ten points. Report the graph and explain what you think that it shows. b) Then, sum the log returns for the "Pre" Period (June 15 to June 22) and the "Post" Period (June 23 to June 30), separately. That is, you will report the sum of the daily log returns as the buy-and- hold return for the Pre and Post periods. What do the buy and hold returns over the Pre and Post periods suggest about the Brexit vote's effect on the British pound relative to the US dollar? c) Next, we need to calculate the expected return for the Pre and Post periods. To do so, we will take the average of the daily log returns for each period. Report the average returns as the average daily return for the "Pre" and "Post". Are the expected returns consistent with your prediction that the Brexit weakened the British pound? 1 When calculating monthly or yearly returns, we will generally apply the following formula to calculate returns as percentage changes: r; = (Pc - Pt-1)/Pt-1. However, because we are calculating daily returns, which tend to not follow a normal distribution we are using log returns. Please note that summing the consecutive log returns produces the buy-and-hold returns, but that will not apply when we use the percentage change formula mentioned above. d) Using the daily log returns, calculate the standard deviation of the British pound to US dollar exchange rate in the Pre and Post periods. Report the standard deviation as the volatility for the "Pre" and "Post. Are the volatilities consistent with your prediction that the Brexit vote increased exchange rate risk? e) You are confident that the behavior of the British pound to US dollar exchange rate after the Brexit vote supports your prediction. You will formally test your hypothesis by performing a t-test. Calculate the t-statistic as tstat = (AvgPost - AvgPre) cre + Bost) , where the averages spre npre are from part B, Spre and Spost are standard deviations from part C, and npre and post are the observations in the Pre and post period, respectively. Do you find support for your prediction that the returns to the British pound to US dollar exchange rate are different is the absolute value of the t-statistic greater than 1.95?). Question 1 It is 2016. You are the financial manager of the Jaguar Land Rover subsidiary of Tata Motors (symbol: TTM). You are considering opening a new facility in the United States or in the United Kingdom. You are concerned that a weak British pound will increase the costs of steel imports that are used to manufacture vehicles. You want to figure out whether the June 23, 2016 Brexit vote weakened the British pound and increased exchange rate risk. Therefore, you will perform an event study of the Brexit vote. That is, you will compare the returns and volatility of the British pound to US dollar exchange rate before and after the vote. You predict that after the Brexit vote that the expected returns to holding pounds are lower and the volatility of the pound is higher. Your challenge is to calculate the returns to the GBP and USD exchange rate (GBP/USD), which will then be used to perform your event study analysis. a) First, calculate the daily log returns for the GBP to USD exchange rate. Go to Yahoo! Finance and click on "Historical Data" for GBP/USD. Click on "Historical Prices" and download daily GBP/USD price data from June 14, 2016 to June 30, 2016. Next, calculate daily log returns for GBP/USD using the equation: rt = ln(Pt/Pt-1), where rt is the return in day t, Pt is the adjusted closing price in day t, and in is the natural log. When calculating returns, make sure your data are sorted so that time is in ascending order, not the default descending order. You will not have a return observation for the first day of your time series. Graph the daily returns on the y-axis versus the date on the x-axis. For the graph, draw a straight line through the ten points. Report the graph and explain what you think that it shows. b) Then, sum the log returns for the "Pre" Period (June 15 to June 22) and the "Post" Period (June 23 to June 30), separately. That is, you will report the sum of the daily log returns as the buy-and- hold return for the Pre and Post periods. What do the buy and hold returns over the Pre and Post periods suggest about the Brexit vote's effect on the British pound relative to the US dollar? c) Next, we need to calculate the expected return for the Pre and Post periods. To do so, we will take the average of the daily log returns for each period. Report the average returns as the average daily return for the "Pre" and "Post". Are the expected returns consistent with your prediction that the Brexit weakened the British pound? 1 When calculating monthly or yearly returns, we will generally apply the following formula to calculate returns as percentage changes: r; = (Pc - Pt-1)/Pt-1. However, because we are calculating daily returns, which tend to not follow a normal distribution we are using log returns. Please note that summing the consecutive log returns produces the buy-and-hold returns, but that will not apply when we use the percentage change formula mentioned above. d) Using the daily log returns, calculate the standard deviation of the British pound to US dollar exchange rate in the Pre and Post periods. Report the standard deviation as the volatility for the "Pre" and "Post. Are the volatilities consistent with your prediction that the Brexit vote increased exchange rate risk? e) You are confident that the behavior of the British pound to US dollar exchange rate after the Brexit vote supports your prediction. You will formally test your hypothesis by performing a t-test. Calculate the t-statistic as tstat = (AvgPost - AvgPre) cre + Bost) , where the averages spre npre are from part B, Spre and Spost are standard deviations from part C, and npre and post are the observations in the Pre and post period, respectively. Do you find support for your prediction that the returns to the British pound to US dollar exchange rate are different is the absolute value of the t-statistic greater than 1.95?)