Question
Question 1: It is typical of an equity analyst to study the annual report in detail. Two of the reasons are that they want to


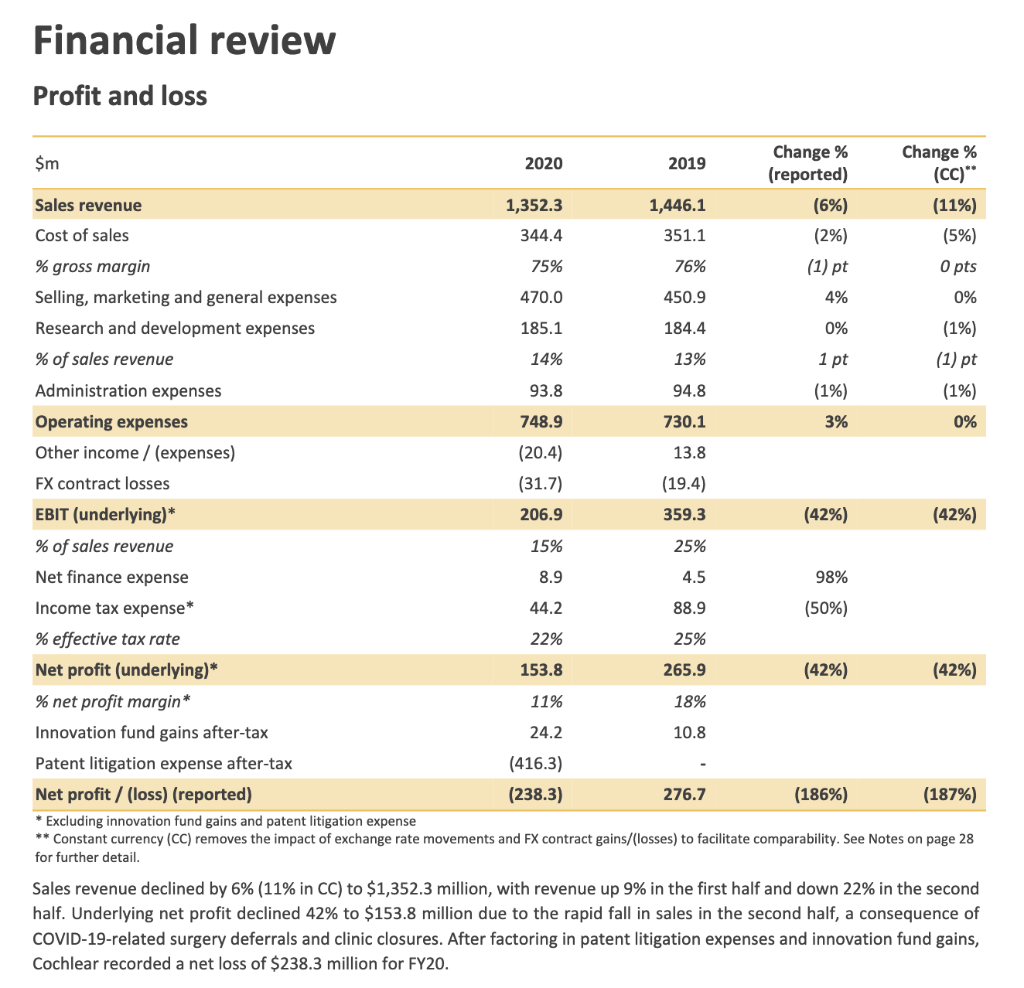
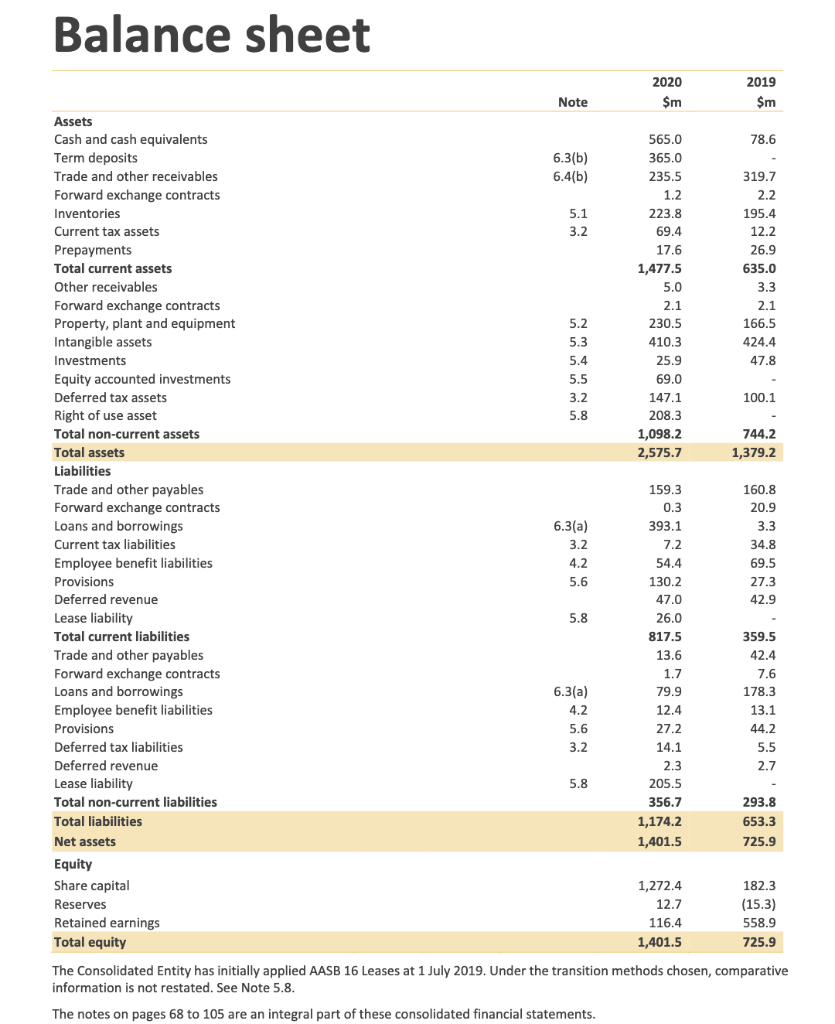
Question 1: It is typical of an equity analyst to study the annual report in detail. Two of the reasons are that they want to identify and put off-balance sheet items on the balance sheet and identify and rearrange peculiar items (from the perspective of the analyst) on the income statement to better reflect the financial position of a company. Show us how the analyst will arrive at the financial ratios of the subject company below for the last financial year.
i. Interest coverage ratio.
ii. Debt to capital ratio based on book value.
iii. Debt to capital ratio based on market value.
Financial review Profit and loss $m 2020 2019 Change % (reported) Change % (CC)** Sales revenue 1,352.3 1,446.1 (6%) (11%) Cost of sales 344.4 351.1 (2%) (5%) % gross margin 75% 76% (1) pt O pts Selling, marketing and general expenses 470.0 450.9 4% 0% Research and development expenses 185.1 184.4 0% (1%) % of sales revenue 14% 13% 1 pt (1) pt Administration expenses 93.8 94.8 (1%) (1%) Operating expenses 748.9 730.1 3% 0% Other income / (expenses) (20.4) 13.8 FX contract losses (31.7) (19.4) EBIT (underlying) * 206.9 359.3 (42%) (42%) % of sales revenue 15% 25% Net finance expense 8.9 4.5 98% Income tax expense* 44.2 88.9 (50%) % effective tax rate 22% 25% Net profit (underlying)* 153.8 265.9 (42%) (42%) % net profit margin* 11% 18% Innovation fund gains after-tax 24.2 10.8 Patent litigation expense after-tax (416.3) Net profit/ (loss) (reported) (238.3) 276.7 (186%) (187%) * Excluding innovation fund gains and patent litigation expense ** Constant currency (CC) removes the impact of exchange rate movements and FX contract gains/(losses) to facilitate comparability. See Notes on page 28 for further detail. Sales revenue declined by 6% (11% in CC) to $1,352.3 million, with revenue up 9% in the first half and down 22% in the second half. Underlying net profit declined 42% to $153.8 million due to the rapid fall in sales in the second half, a consequence of COVID-19-related surgery deferrals and clinic closures. After factoring in patent litigation expenses and innovation fund gains, Cochlear recorded a net loss of $238.3 million for FY20. Balance sheet 2020 2019 Note $m $m Assets 565.0 78.6 365.0 6.3(b) 6.4(b) 235.5 319.7 1.2 2.2 5.1 223.8 69.4 195.4 12.2 3.2 Cash and cash equivalents Term deposits Trade and other receivables Forward exchange contracts Inventories Current tax assets Prepayments Total current assets Other receivables Forward exchange contracts Property, plant and equipment Intangible assets 17.6 26.9 635.0 1,477.5 5.0 3.3 2.1 2.1 5.2 230.5 166.5 5.3 410.3 424.4 Investments 5.4 25.9 47.8 5.5 69.0 3.2 100.1 Equity accounted investments Deferred tax assets Right of use asset Total non-current assets 5.8 147.1 208.3 1,098.2 2,575.7 744.2 Total assets 1,379.2 160.8 159.3 0.3 20.9 6.3(a) 393.1 3.3 3.2 7.2 34.8 4.2 54.4 69.5 5.6 130.2 27.3 47.0 42.9 5.8 Liabilities Trade and other payables Forward exchange contracts Loans and borrowings Current tax liabilities Employee benefit liabilities Provisions Deferred revenue Lease liability Total current liabilities Trade and other payables Forward exchange contracts Loans and borrowings Employee benefit liabilities Provisions Deferred tax liabilities Deferred revenue Lease liability Total non-current liabilities 26.0 817.5 13.6 359.5 42.4 1.7 7.6 79.9 178.3 6.3(a) 4.2 12.4 13.1 5.6 27.2 44.2 3.2 14.1 5.5 2.3 2.7 5.8 205.5 356.7 293.8 Total liabilities 1,174.2 653.3 Net assets 1,401.5 725.9 182.3 Equity Share capital Reserves Retained earnings Total equity 1,272.4 12.7 (15.3) 558.9 116.4 1,401.5 725.9 The Consolidated Entity has initially applied AASB 16 Leases at 1 July 2019. Under the transition methods chosen, comparative information is not restated. See Note 5.8. The notes on pages 68 to 105 are an integral part of these consolidated financial statements. Financial review Profit and loss $m 2020 2019 Change % (reported) Change % (CC)** Sales revenue 1,352.3 1,446.1 (6%) (11%) Cost of sales 344.4 351.1 (2%) (5%) % gross margin 75% 76% (1) pt O pts Selling, marketing and general expenses 470.0 450.9 4% 0% Research and development expenses 185.1 184.4 0% (1%) % of sales revenue 14% 13% 1 pt (1) pt Administration expenses 93.8 94.8 (1%) (1%) Operating expenses 748.9 730.1 3% 0% Other income / (expenses) (20.4) 13.8 FX contract losses (31.7) (19.4) EBIT (underlying) * 206.9 359.3 (42%) (42%) % of sales revenue 15% 25% Net finance expense 8.9 4.5 98% Income tax expense* 44.2 88.9 (50%) % effective tax rate 22% 25% Net profit (underlying)* 153.8 265.9 (42%) (42%) % net profit margin* 11% 18% Innovation fund gains after-tax 24.2 10.8 Patent litigation expense after-tax (416.3) Net profit/ (loss) (reported) (238.3) 276.7 (186%) (187%) * Excluding innovation fund gains and patent litigation expense ** Constant currency (CC) removes the impact of exchange rate movements and FX contract gains/(losses) to facilitate comparability. See Notes on page 28 for further detail. Sales revenue declined by 6% (11% in CC) to $1,352.3 million, with revenue up 9% in the first half and down 22% in the second half. Underlying net profit declined 42% to $153.8 million due to the rapid fall in sales in the second half, a consequence of COVID-19-related surgery deferrals and clinic closures. After factoring in patent litigation expenses and innovation fund gains, Cochlear recorded a net loss of $238.3 million for FY20. Balance sheet 2020 2019 Note $m $m Assets 565.0 78.6 365.0 6.3(b) 6.4(b) 235.5 319.7 1.2 2.2 5.1 223.8 69.4 195.4 12.2 3.2 Cash and cash equivalents Term deposits Trade and other receivables Forward exchange contracts Inventories Current tax assets Prepayments Total current assets Other receivables Forward exchange contracts Property, plant and equipment Intangible assets 17.6 26.9 635.0 1,477.5 5.0 3.3 2.1 2.1 5.2 230.5 166.5 5.3 410.3 424.4 Investments 5.4 25.9 47.8 5.5 69.0 3.2 100.1 Equity accounted investments Deferred tax assets Right of use asset Total non-current assets 5.8 147.1 208.3 1,098.2 2,575.7 744.2 Total assets 1,379.2 160.8 159.3 0.3 20.9 6.3(a) 393.1 3.3 3.2 7.2 34.8 4.2 54.4 69.5 5.6 130.2 27.3 47.0 42.9 5.8 Liabilities Trade and other payables Forward exchange contracts Loans and borrowings Current tax liabilities Employee benefit liabilities Provisions Deferred revenue Lease liability Total current liabilities Trade and other payables Forward exchange contracts Loans and borrowings Employee benefit liabilities Provisions Deferred tax liabilities Deferred revenue Lease liability Total non-current liabilities 26.0 817.5 13.6 359.5 42.4 1.7 7.6 79.9 178.3 6.3(a) 4.2 12.4 13.1 5.6 27.2 44.2 3.2 14.1 5.5 2.3 2.7 5.8 205.5 356.7 293.8 Total liabilities 1,174.2 653.3 Net assets 1,401.5 725.9 182.3 Equity Share capital Reserves Retained earnings Total equity 1,272.4 12.7 (15.3) 558.9 116.4 1,401.5 725.9 The Consolidated Entity has initially applied AASB 16 Leases at 1 July 2019. Under the transition methods chosen, comparative information is not restated. See Note 5.8. The notes on pages 68 to 105 are an integral part of these consolidated financial statementsStep by Step Solution
There are 3 Steps involved in it
Step: 1

Get Instant Access to Expert-Tailored Solutions
See step-by-step solutions with expert insights and AI powered tools for academic success
Step: 2

Step: 3

Ace Your Homework with AI
Get the answers you need in no time with our AI-driven, step-by-step assistance
Get Started


