Answered step by step
Verified Expert Solution
Link Copied!

Question

1 Approved Answer

Question 1 Lavare, located in the Chicago suburbs, is a major manufacturer of stainless steel sinks. Lavare is in the middle of the demand and

Question 1

Lavare, located in the Chicago suburbs, is a major manufacturer of stainless steel sinks. Lavare is in the middle of the demand and supply planning exercise for the coming year. Anticipated monthly demand from distributors over the 12 months in shown in the table below.

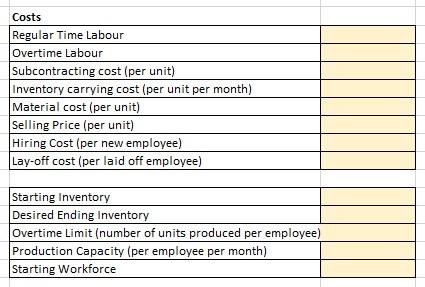
Capacity at Lavare is governed by the number of machine operators it hires. The firm works 20 days a month, with a regular operating shift of eight hours per day. Any time beyond that is considered overtime. Regular-time pay is $15 per hour and overtime is $22 per hour. Overtime is limited to 20 hours per month per employee. The plant currently has 250 employees. Each sink requires two hours of labor input. It costs $3 to carry a sink in inventory for a month. Materials cost per sink is $40. Sinks are sold to distributors at a price of $125 each. We assume that no stockouts are allowed and the starting inventory entering January is 5,000 units and the desired ending inventory in December is also 5,000 units.

Market research has indicated that a promotion dropping prices by 1 percent in a given month will increase sales in that month by 20 percent and bring forward 10 percent demand from each of the following two months. Thus, a 1 percent drop in price in March increase sales in March by 3,000(=0.2 * 15,000) and shifts 1,800(=0.1 * 18,000) units in demand from April and 2,500(=0.1 * 25,000) units from May forward to March.

Table Anticipated Monthly Demand at Lavare

Month

Demand Forecast

January

10,000

February

11,000

March

16,000

April

19,000

May

22,000

June

25,000

July

31,000

August

28,000

September

22,000

October

19,000

November

13,000

December

12,000

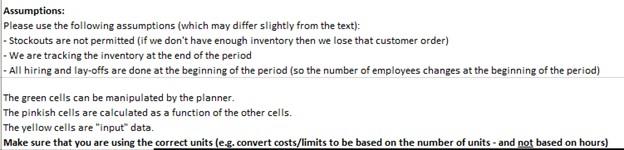
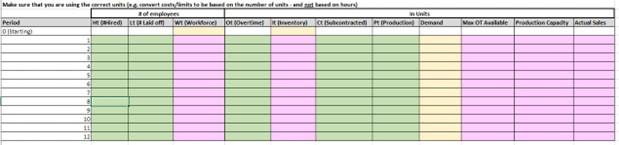
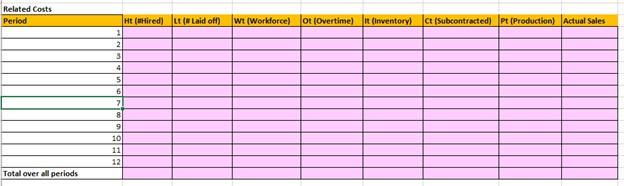
Please put in all the columns in the excel file which are in the screenshots and fill in the columns. Show the solutions and the formulas used in the excel file. Do not use Excel Solver. If the screenshots are not clear, give me the access to attach the required excel file in chegg for your reference.

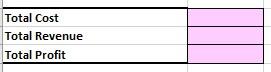
What is the optimal production plan for the year if we assume no promotions? What is the annual profit from this plan? What is the cost of this plan?

image text in transcribed

image text in transcribed

image text in transcribed

image text in transcribed

image text in transcribed

Assumptions: Please use the following assumptions (which may differ slightly from the text): - Stockouts are not permitted (if we don't have enough inventory then we lose that customer order) - We are tracking the inventory at the end of the period - All hiring and lay-offs are done at the beginning of the period (so the number of employees changes at the beginning of the period) The green cells can be manipulated by the planner. The pinkish cells are calculated as a function of the other cells. The yellow cells are "input" data. Make sure that you are using the correct units (e.g. convert costs/limits to be based on the number of units - and not based on hours) Total Cost Total Revenue Total Profit Costs \begin{tabular}{|l|l|} \hline Regular Time Labour & \\ \hline Overtime Labour & \\ \hline Subcontracting cost (per unit) & \\ \hline Inventory carrying cost (per unit per month) & \\ \hline Material cost (per unit) & \\ \hline Selling Price (per unit) & \\ \hline Hiring cost (per new employee) & \\ \hline Lay-off cost (per laid off employee) & \\ \hline \end{tabular} \begin{tabular}{|l|l|} \hline Starting Inventory & \\ \hline Desired Ending Inventory & \\ \hline \multicolumn{2}{|l|}{ Overtime Limit (number of units produced per employee) } \\ \hline Production Capacity (per employee per month) & \\ \hline Starting Workforce & \\ \hline \end{tabular} Assumptions: Please use the following assumptions (which may differ slightly from the text): - Stockouts are not permitted (if we don't have enough inventory then we lose that customer order) - We are tracking the inventory at the end of the period - All hiring and lay-offs are done at the beginning of the period (so the number of employees changes at the beginning of the period) The green cells can be manipulated by the planner. The pinkish cells are calculated as a function of the other cells. The yellow cells are "input" data. Make sure that you are using the correct units (e.g. convert costs/limits to be based on the number of units - and not based on hours) Total Cost Total Revenue Total Profit Costs \begin{tabular}{|l|l|} \hline Regular Time Labour & \\ \hline Overtime Labour & \\ \hline Subcontracting cost (per unit) & \\ \hline Inventory carrying cost (per unit per month) & \\ \hline Material cost (per unit) & \\ \hline Selling Price (per unit) & \\ \hline Hiring cost (per new employee) & \\ \hline Lay-off cost (per laid off employee) & \\ \hline \end{tabular} \begin{tabular}{|l|l|} \hline Starting Inventory & \\ \hline Desired Ending Inventory & \\ \hline \multicolumn{2}{|l|}{ Overtime Limit (number of units produced per employee) } \\ \hline Production Capacity (per employee per month) & \\ \hline Starting Workforce & \\ \hline \end{tabular}

Step by Step Solution

There are 3 Steps involved in it

Step: 1

blur-text-image

Get Instant Access to Expert-Tailored Solutions

See step-by-step solutions with expert insights and AI powered tools for academic success

Step: 2

blur-text-image

Step: 3

blur-text-image

Ace Your Homework with AI

Get the answers you need in no time with our AI-driven, step-by-step assistance

Get Started

Recommended Textbook for

Contemporary Issues In Behavioral Finance

Authors: Simon Grima

1st Edition

1787698823, 978-1787698826

More Books

Students also viewed these Finance questions

Question

7. Identify six intercultural communication dialectics.

Answered: 1 week ago