Question: Question 1: Make sure you set up your notebook to produce matplotlib plots and import the right modules, as well NumPy. Do that here. import


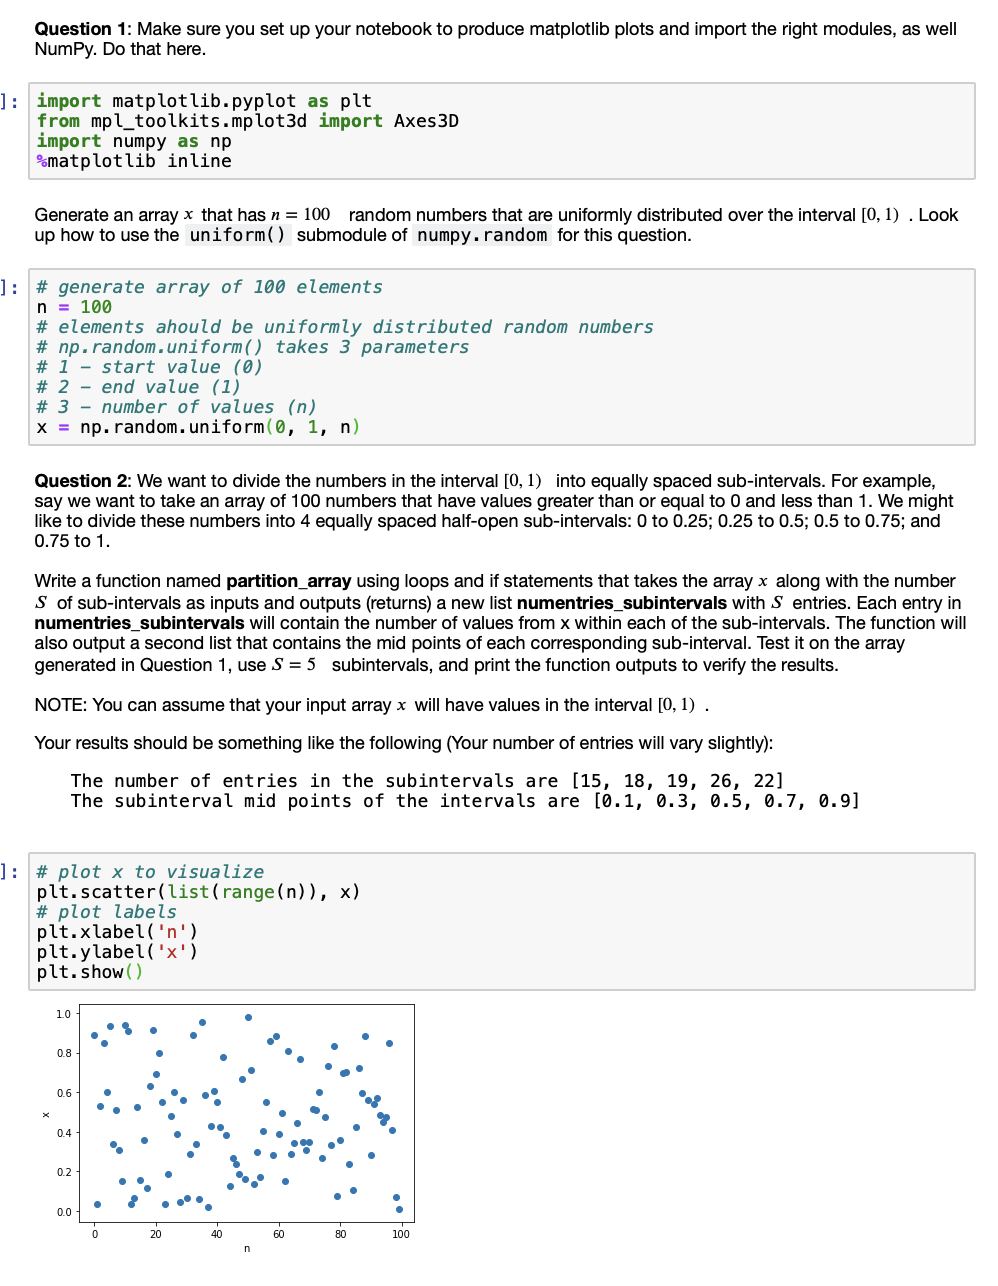
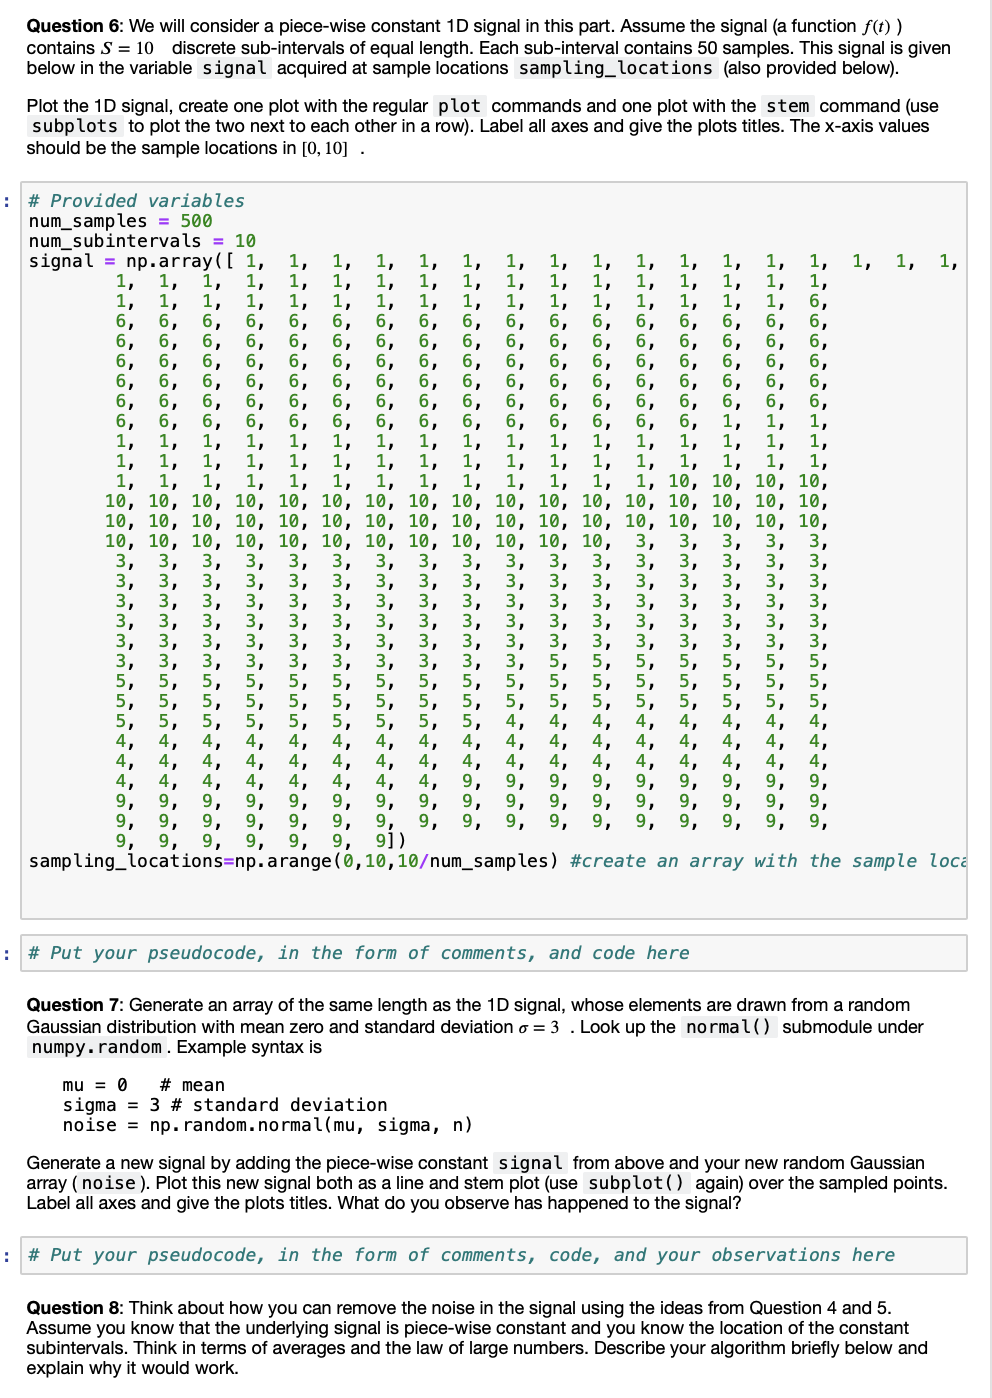
Question 1: Make sure you set up your notebook to produce matplotlib plots and import the right modules, as well NumPy. Do that here. import matplotlib.pyplot as plt from mpl_toolkits.mplot3d import Axes 3D import numpy as np %matplotlib inline Generate an array x that has n = 100 random numbers that are uniformly distributed over the interval [0, 1) . Look up how to use the uniform() submodule of numpy. random for this question. # generate array of 100 elements n = 100 # elements ahould be uniformly distributed random numbers # np.random.uniform() takes 3 parameters # 1 - start value (0) # 2 - end value (1) # 3 - number of values (n) x = np. random.uniform(0, 1, n) Question 2: We want to divide the numbers in the interval [0, 1) into equally spaced sub-intervals. For example, say we want to take an array of 100 numbers that have values greater than or equal to 0 and less than 1. We might like to divide these numbers into 4 equally spaced half-open sub-intervals: 0 to 0.25, 0.25 to 0.5, 0.5 to 0.75, and 0.75 to 1. Write a function named partition_array using loops and if statements that takes the array x along with the number S of sub-intervals as inputs and outputs (returns) a new list numentries_subintervals with S entries. Each entry in numentries_subintervals will contain the number of values from x within each of the sub-intervals. The function will also output a second list that contains the mid points of each corresponding sub-interval. Test it on the array generated in Question 1, use S = 5 subintervals, and print the function outputs to verify the results. NOTE: You can assume that your input array x will have values in the interval [0, 1). Your results should be something like the following (Your number of entries will vary slightly): The number of entries in the subintervals are [15, 18, 19, 26, 22] The subinterval mid points of the intervals are [0.1, 0.3, 0.5, 0.7, 0.9] # plot x to visualize plt. scatter(list (range(n)), x) # plot labels plt.xlabel('n') plt. y label('x') plt.show() Question 6: We will consider a piece-wise constant 1D signal in this part. Assume the signal (a function f(t)) contains S = 10 discrete sub-intervals of equal length. Each sub-interval contains 50 samples. This signal is given below in the variable signal acquired at sample locations sampling_locations (also provided below). Plot the 1D signal, create one plot with the regular plot commands and one plot with the stem command (use subplots to plot the two next to each other in a row). Label all axes and give the plots titles. The X-axis values should be the sample locations in [0, 10] . # Provided variables num_samples = 500 num_subintervals = 10 signal = np.array([ 1, 1, 1, 1, 1, --- - * - --- === == --- --- - - G === --- --- --- = = = = = = = = = >>> --- o == --- --- === --- 0 0 0 0 0 --- o o o - === === - = = = == === = = = = = = = = = = = = = = 4, 4, 4, 4, 4, 4, 4, 4, 4, 4, 4, 4, 4, 4, 4, 4, 4, 9, 9, 9, 9, 9, 9, 9, 9, 9, 9, 9, 9, 9, 9, 9, 9, 9, 9, 9, 9, 9, 9, 9, 9, 9, 9, 9, 9, 9, 9, 9, 9, 9, 9, 9, 9, 9,9,99,99,9j) sampling_locations=np.arange(0,10,10um_samples) #create an array with the sample loca 9,99, # Put your pseudocode, in the form of comments, and code here Question 7: Generate an array of the same length as the 1D signal, whose elements are drawn from a random Gaussian distribution with mean zero and standard deviation o=3. Look up the normal() submodule under numpy. random . Example syntax is mu = 0 # mean sigma = 3 # standard deviation noise = np. random.normal(mu, sigma, n) Generate a new signal by adding the piece-wise constant signal from above and your new random Gaussian array ( noise). Plot this new signal both as a line and stem plot (use subplot() again) over the sampled points. Label all axes and give the plots titles. What do you observe has happened to the signal? # Put your pseudocode, in the form of comments, code, and your observations here Question 8: Think about how you can remove the noise in the signal using the ideas from Question 4 and 5. Assume you know that the underlying signal is piece-wise constant and you know the location of the constant subintervals. Think in terms of averages and the law of large numbers. Describe your algorithm briefly below and explain why it would work. Question 1: Make sure you set up your notebook to produce matplotlib plots and import the right modules, as well NumPy. Do that here. import matplotlib.pyplot as plt from mpl_toolkits.mplot3d import Axes 3D import numpy as np %matplotlib inline Generate an array x that has n = 100 random numbers that are uniformly distributed over the interval [0, 1) . Look up how to use the uniform() submodule of numpy. random for this question. # generate array of 100 elements n = 100 # elements ahould be uniformly distributed random numbers # np.random.uniform() takes 3 parameters # 1 - start value (0) # 2 - end value (1) # 3 - number of values (n) x = np. random.uniform(0, 1, n) Question 2: We want to divide the numbers in the interval [0, 1) into equally spaced sub-intervals. For example, say we want to take an array of 100 numbers that have values greater than or equal to 0 and less than 1. We might like to divide these numbers into 4 equally spaced half-open sub-intervals: 0 to 0.25, 0.25 to 0.5, 0.5 to 0.75, and 0.75 to 1. Write a function named partition_array using loops and if statements that takes the array x along with the number S of sub-intervals as inputs and outputs (returns) a new list numentries_subintervals with S entries. Each entry in numentries_subintervals will contain the number of values from x within each of the sub-intervals. The function will also output a second list that contains the mid points of each corresponding sub-interval. Test it on the array generated in Question 1, use S = 5 subintervals, and print the function outputs to verify the results. NOTE: You can assume that your input array x will have values in the interval [0, 1). Your results should be something like the following (Your number of entries will vary slightly): The number of entries in the subintervals are [15, 18, 19, 26, 22] The subinterval mid points of the intervals are [0.1, 0.3, 0.5, 0.7, 0.9] # plot x to visualize plt. scatter(list (range(n)), x) # plot labels plt.xlabel('n') plt. y label('x') plt.show() Question 6: We will consider a piece-wise constant 1D signal in this part. Assume the signal (a function f(t)) contains S = 10 discrete sub-intervals of equal length. Each sub-interval contains 50 samples. This signal is given below in the variable signal acquired at sample locations sampling_locations (also provided below). Plot the 1D signal, create one plot with the regular plot commands and one plot with the stem command (use subplots to plot the two next to each other in a row). Label all axes and give the plots titles. The X-axis values should be the sample locations in [0, 10] . # Provided variables num_samples = 500 num_subintervals = 10 signal = np.array([ 1, 1, 1, 1, 1, --- - * - --- === == --- --- - - G === --- --- --- = = = = = = = = = >>> --- o == --- --- === --- 0 0 0 0 0 --- o o o - === === - = = = == === = = = = = = = = = = = = = = 4, 4, 4, 4, 4, 4, 4, 4, 4, 4, 4, 4, 4, 4, 4, 4, 4, 9, 9, 9, 9, 9, 9, 9, 9, 9, 9, 9, 9, 9, 9, 9, 9, 9, 9, 9, 9, 9, 9, 9, 9, 9, 9, 9, 9, 9, 9, 9, 9, 9, 9, 9, 9, 9,9,99,99,9j) sampling_locations=np.arange(0,10,10um_samples) #create an array with the sample loca 9,99, # Put your pseudocode, in the form of comments, and code here Question 7: Generate an array of the same length as the 1D signal, whose elements are drawn from a random Gaussian distribution with mean zero and standard deviation o=3. Look up the normal() submodule under numpy. random . Example syntax is mu = 0 # mean sigma = 3 # standard deviation noise = np. random.normal(mu, sigma, n) Generate a new signal by adding the piece-wise constant signal from above and your new random Gaussian array ( noise). Plot this new signal both as a line and stem plot (use subplot() again) over the sampled points. Label all axes and give the plots titles. What do you observe has happened to the signal? # Put your pseudocode, in the form of comments, code, and your observations here Question 8: Think about how you can remove the noise in the signal using the ideas from Question 4 and 5. Assume you know that the underlying signal is piece-wise constant and you know the location of the constant subintervals. Think in terms of averages and the law of large numbers. Describe your algorithm briefly below and explain why it would work
Step by Step Solution
There are 3 Steps involved in it

Get step-by-step solutions from verified subject matter experts


