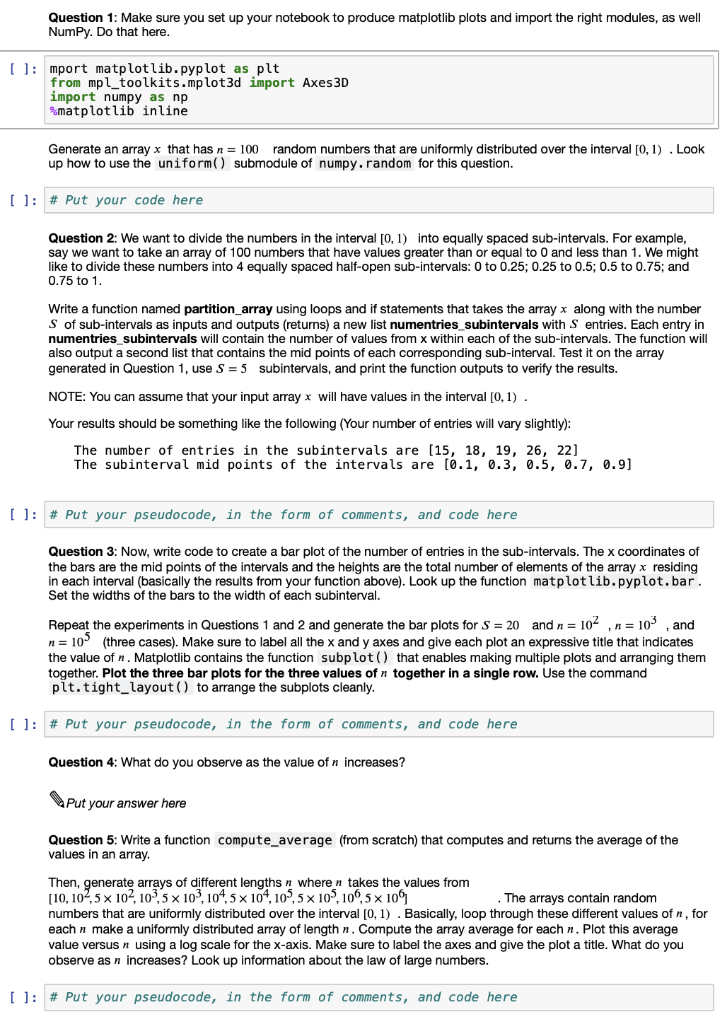
Question 1: Make sure you set up your notebook to produce matplotlib plots and import the right modules, as well NumPy. Do that here. mport matplotlib.pyp lot as plt from mpl_toolkits.mp lot3d import Axes 3D import numpy as np %matplotlib inline Generate an array x that has n = 100 random numbers that are uniformly distributed over the interval [0, 1) . Look up how to use the uniform() submodule of numpy. random for this question. []: # Put your code here Question 2: We want to divide the numbers in the interval [0, 1) into equally spaced sub-intervals. For example, say we want to take an array of 100 numbers that have values greater than or equal to 0 and less than 1. We might like to divide these numbers into 4 equally spaced half-open sub-intervals: 0 to 0.25; 0.25 to 0.5; 0.5 to 0.75; and 0.75 to 1. Write a function named partition_array using loops and if statements that takes the array x along with the number S of sub-intervals as inputs and outputs (returns) a new list numentries_subintervals with S entries. Each entry in umber of values from x within each of the sub-intervals. The function will also output a second list that contains the mid points of each corresponding sub-interval. Test it on the array generated in Question 1, use S = 5 subintervals, and print the function outputs to verify the results. NOTE: You can assume that your input array x will have values in the interval [0,1). Your results should be something like the following (Your number of entries will vary slightly): The number of entries in the subintervals are [15, 18, 19, 26, 22] The subinterval mid points of the intervals are [0.1, 0.3, 0.5, 0.7, 0.9) []: # Put your pseudocode, in the form of comments, and code here Question 3: Now, write code to create a bar plot of the number of entries in the sub-intervals. The x coordinates of the bars are the mid points of the intervals and the heights are the total number of elements of the array x residing in each interval (basically the results from your function above). Look up the function matplotlib.pyplot.bar. Set the widths of the bars to the width of each subinterval. Repeat the experiments in Questions 1 and 2 and generate the bar plots for S = 20 and n = 10, n = 10" , and n = 10 (three cases). Make sure to label all the x and y axes and give each plot an expressive title that indicates the value of n. Matplotlib contains the function subplot() that enables making multiple plots and arranging them together. Plot the three bar plots for the three values of n together in a single row. Use the command plt. tight_layout() to arrange the subplots cleanly. []: # Put your pseudocode, in the form of comments, and code here Question 4: What do you observe as the value of n increases? Put your answer here Question 5: Write a function compute_average (from scratch) that computes and returns the average of the values in an array. Then, generate arrays of different lengths n where n takes the values from [10, 104,5 x 10⁴, 105 X 10", 104,5 x 10⁴, 109,5 x 10,100,5 x 109 . The arrays contain random numbers that are uniformly distributed over the interval [0, 1) . Basically, loop through these different values of n, for each n make a uniformly distributed array of length n. Compute the array average for each n. Plot this average value versus n using a log scale for the x-axis. Make sure to label the axes and give the plot a title. What do you observe as n increases? Look up information about the law of large numbers. []: # Put your pseudocode, in the form of comments, and code here