Question 1) Please answer following question 1- A, B, C, D, E, F, G from this article. All data, graphs and material in article for
Question 1)
Please answer following question 1- A, B, C, D, E, F, G from this article. All data, graphs and material in article for the questions provided below.
National Health Care Spending In2018: Growth Driven By Accelerations In Medicare And Private Insurance Spending.
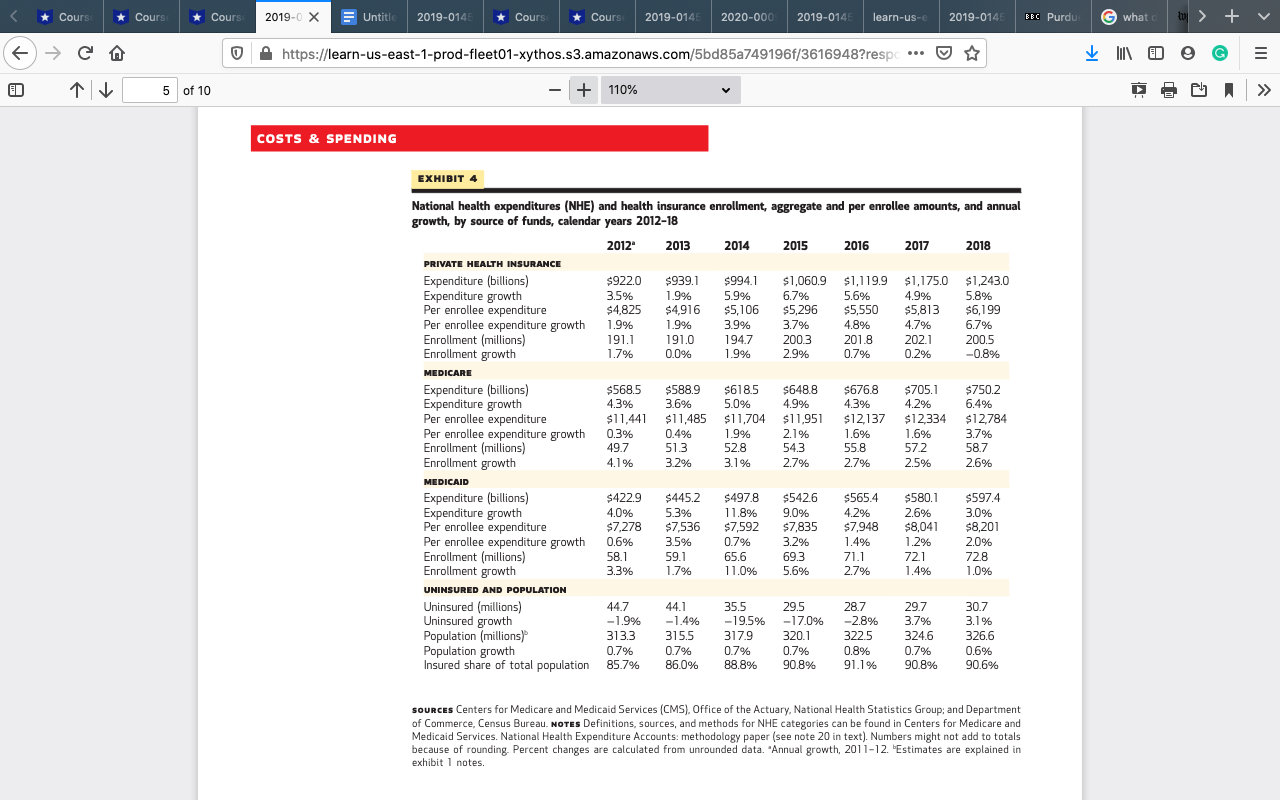
Abstract: US health care spending increased 4.6 percent to reach$3.6 trillion in 2018, a faster growth rate than the rate of 4.2 percent in2017 but the same rate as in 2016. The share of the economy devoted to health care spending declined to 17.7 percent in 2018, compared to17.9 percent in 2017. The 0.4-percentage-point acceleration in overall growth in 2018 was driven by faster growth in both private health insurance and Medicare, which were influenced by the reinstatement of the health insurance tax. For personal health care spending (which accounted for 84 percent of national health care spending), growth in2018 remained unchanged from 2017 at 4.1 percent. The total number of uninsured people increased by 1.0 million for the second year in a row, toreach 30.7 million in 2018.
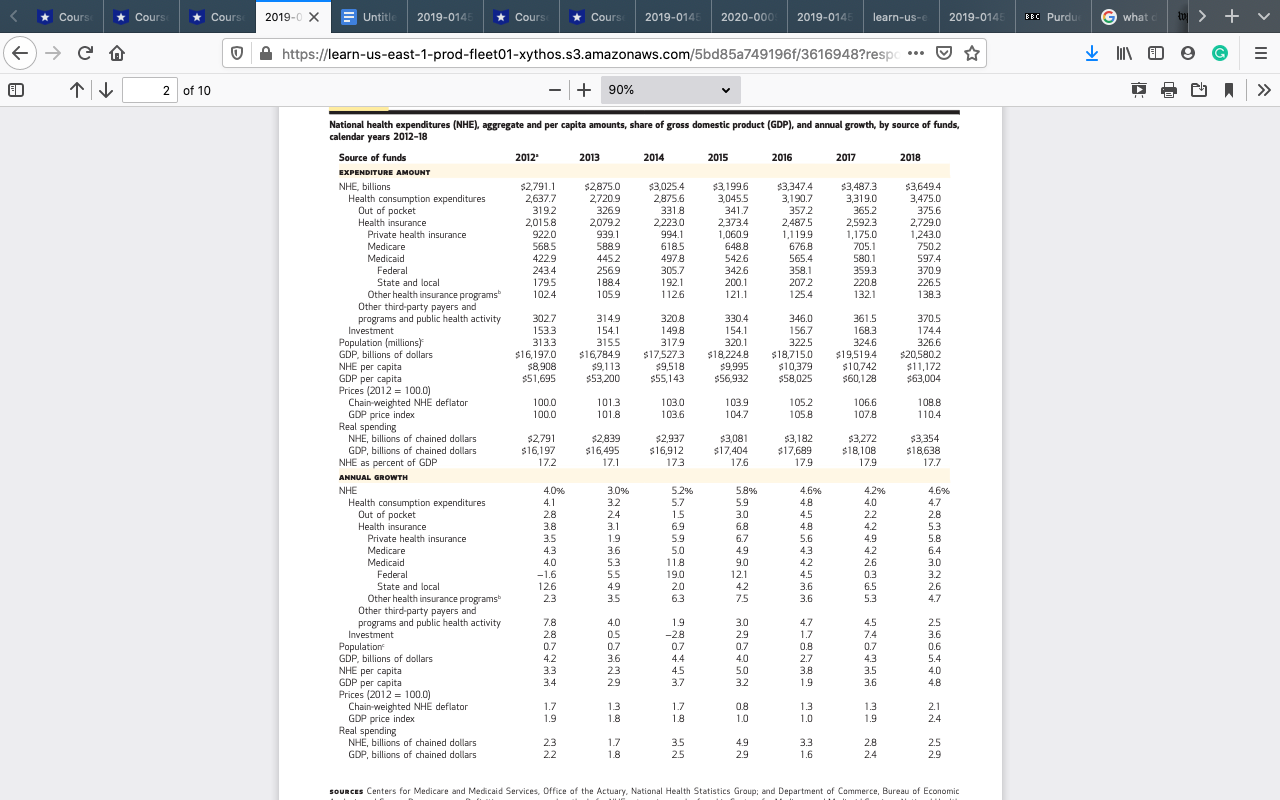
Total healthcare spending in the United States increased 4.6 percent to reach $3.6 trillion in 2018, or $11,172 per person?a faster growth rate than the rate of 4.2 percent in2017 and equal to the rate in 2016 (exhibit 1).1Just as growth was relatively stable over this period, so too was the share of the economy devoted to healthcare as measured by gross domestic product (GDP), which was 17.9 percent in 2016-17 and 17.7 percent in 2018.
Much of the faster spending growth in 2018was associated not with expenditures for goods and services but instead with the net cost of health insurance (the amount of insurance spending attributed to non medical expenses, including administration, taxes, and underwriting gains or losses). The net cost of health insurance grew more rapidly in 2018, increasing 13.2 per-cent after growing 4.3 percent in 2017. 2Thefaster growth in 2018 was driven primarily by the health insurance tax, a fee that was reinstated in 2018 following a one-year moratorium in2017. 3,4This fee was imposed on all health insurance providers beginning in 2014 as part of the funding for the Affordable Care Act (ACA). The Consolidated Appropriations Act of 2016 instituted a one-year moratorium on it for 2017.
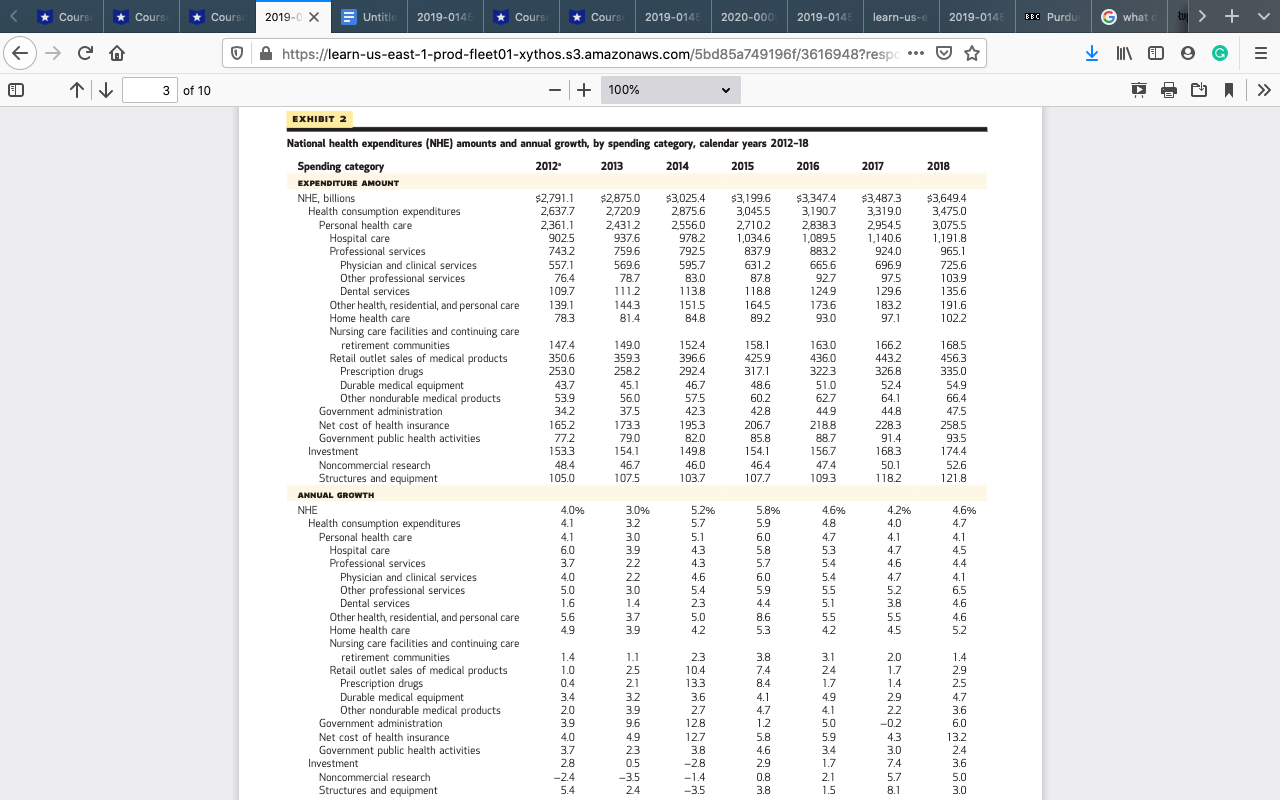
The growth rate for total personal health care spending (expenditures for health care goods and services) was the same in 2017 and 2018(4.1 percent) (exhibit 2). That spending ac-counted for 84 percent of total national health expenditures in 2018. Its stable growth of 4.1 per-cent in 2018 reflected mixed trends in the three largest goods and services categories: hospital care, physician and clinical services, and retail prescription drugs. Together, spending for these categories accounted for 73 percent of total personal health care expenditures. Hospital spending growth was similar in 2017 and 2018, at4.7 percent and 4.5 percent, respectively. For Physician and clinical services, spending growth slowed from 4.7 percent in 2017 to 4.1 percent in 2018, while growth in retail prescription drug spending increased from 1.4 percent in 2017 to 2.5 percent in 2018.
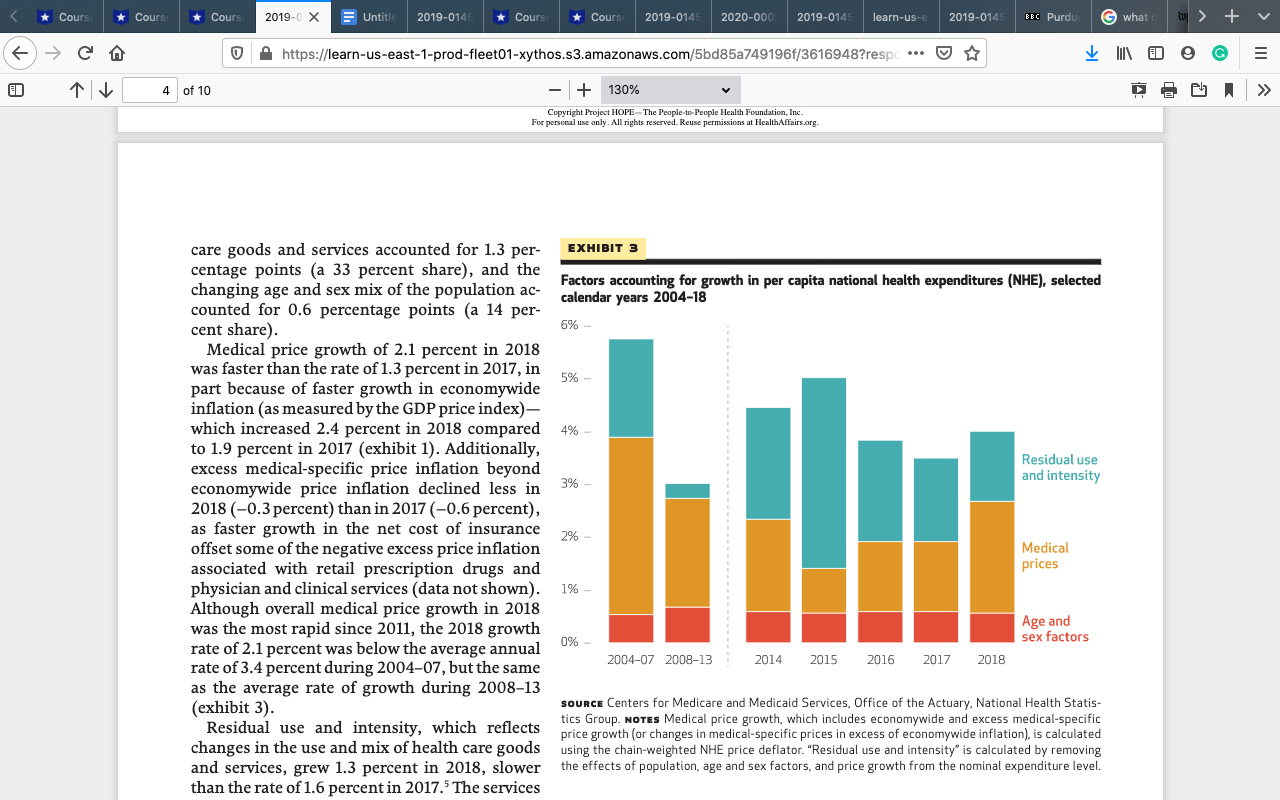
* Cours * Cours * Cours 2019-0 X Untitle 2019-0145 * Course 2019-0145 2020-000 2019-0145 learn-us-e 2019-0145 BBC Purdue -CA https://learn-us-east-1-prod-fleet01-xythos.s3.amazonaws.com/5bd85a749196f/3616948?respc ... 2 of 10 90% > > National health expenditures (NHE), aggregate and per capita amounts, share of gross domestic product (GDP), and annual growth, by source of funds, calendar years 2012-18 Source of funds 2012' 2013 2014 2015 2016 2017 2018 EXPENDITURE AMOUNT NHE, billions $2,791.1 $2875.0 $3,347.4 $3,649.4 Health consumption expenditures 2,720.9 2.875.6 3,190.7 3,319.0 3,475.0 Out of pocket 319.2 3269 331.8 341.7 365.2 375.6 Health insurance 2,015.8 2079.2 2.223.0 2,592.3 2,729.0 Private health insurance 9220 9391 994.1 1.060.9 1.175.0 1.243.0 Medicare 568.5 5889 6185 648.8 676.8 705.1 750.2 445.2 497 8 542.6 597.4 243.4 2569 305.7 342.6 358.1 359.3 370.9 State and local 179.5 192.1 200.1 207.2 220.8 226.5 Other health insurance programs 102.4 105.9 112.6 121.1 125.4 132.1 Other third-party payers and programs and public health activity 3027 3149 320.8 330.4 346.0 361.5 370.5 Investment 153.3 1541 1498 154.1 156.7 168.3 174.4 Population (millions) 313.3 315.5 3179 320.1 322.5 324.6 326.6 GDP, billions of dollars $16,197.0 $16,7849 $17 5273 $18.224.8 $18,715.0 $19,519.4 $20,580.2 NHE per capita $9.995 6/E'OLS $10,742 $11,172 GDP per capita $51,695 $55,143 $56,932 $63,004 Prices (2012 = 100.0) Chain weighted NHE deflator 100.0 101.3 103.0 103.9 106.6 108.8 GDP price index 100.0 101.8 103.6 104.7 105.8 107.8 110.4 Real spending NHE, billions of chained dollars $2.839 $2.937 $3,081 $3.272 GDP, billions of chained dollars $16,197 $16,495 $16,912 $17,689 $18,108 $18,638 NHE as percent of GDP 17.2 173 17.6 17.9 179 ANNUAL GROWTH NHE 4.0% 3.0% 5.2% 5.8% 4.6% 4.2% 4.6% Health consumption expenditures 4.1 3.2 59 4.8 4.0 47 Out of pocket 2.8 3.0 45 69 2.2 2.8 Health insurance 3.8 6.8 4.8 4.2 53 Private health insurance 35 5.9 5.6 4.9 5.8 Medicare 4.3 3.6 5.0 4.2 6.4 11.8 19.0 2.6 12.1 0.3 State and local 6.5 Other health insurance programs 23 63 3.6 5.3 47 Other third-party payers and programs and public health activity 7.8 4.0 0.5 19 -28 3.0 0.7 1.7 4.5 2.5 28 29 4.7 3.6 Population 0.7 4.0 0.8 7.4 0.6 GDP, billions of dollars 4.2 3.3 3.6 5.0 2.7 0.7 4.3 5.4 NHE per capita 32 19 3.5 34 3.6 Prices (2012 = Chain-weighted NHE deflator 1.7 LC 1.3 GDP price index 19 18 18 0.8 19 2.1 24 Real spending NHE, billions of chained dollars 2.3 1.7 2.5 25 3.3 2.8 22 4.9 GDP, billions of chained dollars 16 24 29* Cours * Cours * Cours 2019-0 X Untitle 2019-0145 * Course 2019-0145 2020-000 2019-0145 learn-us-e 2019-0145 BBC Purdu -CA O https://learn-us-east-1-prod-fleet01-xythos.s3.amazonaws.com/5bd85a749196f/3616948?respc ... E 3 of 10 - + 100% > > EXHIBIT 2 National health expenditures (NHE) amounts and annual growth, by spending category, calendar years 2012-18 Spending category 2012- 2013 2014 2015 2016 2017 2018 EXPENDITURE AMOUNT NHE, billions $2,791.1 $2,875.0 $3,025.4 $3,199.6 $3,487.3 $3,649.4 Health consumption expenditures 2,637.7 3,045.5 3,190.7 3,475.0 Personal health care 2,431.2 2.556.0 2.8383 3,075.5 Hospital care 902.5 937.6 978.2 1,034.6 1,089 5 1,140.6 1,191.8 Professional services 743.2 759.6 792.5 837.9 883.2 924.0 965.1 Physician and clinical services 557.1 595.7 631.2 665.6 696.9 725.6 Other professional services 76.4 83.0 87.8 927 97.5 03.9 Dental services 111.2 113.8 118.8 124.9 135.6 Other health, residential, and personal care 139.1 1443 151.5 173.6 183.2 191.6 Home health care 78.3 81.4 848 89.2 93.0 97.1 102.2 Nursing care facilities and continuing care retirement communities 147.4 149.0 158.1 163.0 166.2 168.5 Retail outlet sales of medical products 350.6 3593 396.6 425.9 436.0 456.3 Prescription drugs 253.0 2582 292.4 317.1 3223 335.0 Durable medical equipment 43.7 45.1 46.7 48.6 51.0 52.4 54.9 Other nondurable medical products 53.9 56.0 57.5 60.2 627 64.1 66.4 Government administration 34.2 42.3 42.8 44.9 44.8 47.5 Net cost of health insurance 165.2 195.3 206.7 258.5 Government public health activities 77.2 79.0 82.0 85.8 887 91.4 93.5 Investment 153.3 154.1 149.8 154.1 168.3 74.4 Noncommercial research 48.4 46.0 46.4 47.4 50.1 52.6 Structures and equipment 105.0 107.5 107.7 118.2 ANNUAL GROWTH NHE 4.0% 3.0% 5.2% 4.6% 4.2% 4.6% Health consumption expenditures 4.1 3.2 5.7 5.9 4.8 4.0 4.7 Personal health care 4.1 3.0 4.7 Hospital care 6.0 3.9 5.3 Professional services 3.7 5.4 4.6 Physician and clinical services 40 4.6 6.0 4.7 4.1 Other professional services 5.0 5.4 5.9 5.4 3.0 5.2 6.5 Dental services 1.6 3.8 4.6 Other health, residential, and personal care 5.6 3.7 5.0 8.6 5.5 4.6 Home health care 49 3.9 4.2 4.2 4.5 5.2 Nursing care facilities and continuing care retirement communities 1.4 2.3 10 10.4 3.8 3.1 2.0 1.7 1.7 1.4 Retail outlet sales of medical products 2.9 Prescription drugs 0.4 13.3 8.4 1.4 Durable medical equipment 3.4 4.9 2.9 Other nondurable medical products 3.9 4.1 Government administration 5.0 3.6 9.6 -0.2 6.0 Net cost of health insurance 3.2 Government public health activities 3.0 2.4 Investment 2.8 7.4 3.6 Noncommercial research -2.4 -35 Structures and equipment 24 35 0.8 5.0 38 30* Cours *Cours * Cours 2019-0 X Untitle 2019-0145 * Course * Course 2019-0145 2020-000 2019-0145 learn-us-e 2019-0145 BBC Purdue what d + -CA O A https://learn-us-east-1-prod-fleet01-xythos.s3.amazonaws.com/5bd85a749196f/3616948?respc ... E CE 4 of 10 + 130% > > Copyright Project HOPE-The People-to-People Health Foundation, Inc. For personal use only. All rights reserved. Reuse permissions at HealthAffairs.org. care goods and services accounted for 1.3 per- EXHIBIT 3 centage points (a 33 percent share), and the changing age and sex mix of the population ac- Factors accounting for growth in per capita national health expenditures (NHE), selected counted for 0.6 percentage points (a 14 per- calendar years 2004-18 cent share). 6% - Medical price growth of 2.1 percent in 2018 was faster than the rate of 1.3 percent in 2017, in part because of faster growth in economywide 5% - inflation (as measured by the GDP price index)- which increased 2.4 percent in 2018 compared 4% - to 1.9 percent in 2017 (exhibit 1). Additionally, excess medical-specific price inflation beyond Residual use economywide price inflation declined less in 3% - and intensity 2018 (-0.3 percent) than in 2017 (-0.6 percent), as faster growth in the net cost of insurance offset some of the negative excess price inflation 2% - Medical associated with retail prescription drugs and prices physician and clinical services (data not shown). 1% - Although overall medical price growth in 2018 was the most rapid since 2011, the 2018 growth Age and rate of 2.1 percent was below the average annual 0% - sex factors rate of 3.4 percent during 2004-07, but the same 2004-07 2008-13 2014 2015 2016 2017 2018 as the average rate of growth during 2008-13 (exhibit 3). SOURCE Centers for Medicare and Medicaid Services, Office of the Actuary, National Health Statis- Residual use and intensity, which reflects tics Group. NOTES Medical price growth, which includes economywide and excess medical-specific changes in the use and mix of health care goods price growth (or changes in medical-specific prices in excess of economywide inflation), is calculated using the chain-weighted NHE price deflator. "Residual use and intensity" is calculated by removing and services, grew 1.3 percent in 2018, slower the effects of population, age and sex factors, and price growth from the nominal expenditure level. than the rate of 1.6 percent in 2017. The services* Cours * Cours * Cours 2019-0 X Untitle 2019-0145 * Course * Course 2019-0145 2020-000 2019-0145 learn-us-e 2019-0145 BBC Purdue what d + -CA https://learn-us-east-1-prod-fleet01-xythos.s3.amazonaws.com/5bd85a749196f/3616948?respc ... E CE 5 of 10 + 110% > > COSTS & SPENDING EXHIBIT 4 National health expenditures (NHE) and health insurance enrollment, aggregate and per enrollee amounts, and annual growth, by source of funds, calendar years 2012-18 2012" 2013 2014 2015 2016 2017 2018 PRIVATE HEALTH INSURANCE Expenditure (billions) $922.0 $939.1 $994.1 $1,060.9 $1,119.9 $1,175.0 $1,243.0 Expenditure growth 3.5% 1.9% 5.9% 6.7% 5.6% 4.9% 5.8% Per enrollee expenditure $4.825 $4,916 $5,106 $5,296 $5,550 $5,813 $6,199 Per enrollee expenditure growth 1.9% 1.9% 3.9% 3.7% 4.8% 4.7% 6.7% Enrollment (millions) 191.1 191.0 194.7 200.3 201.8 202.1 200.5 Enrollment growth 1.7% 0.0% 1.9% 2.9% 0.7% 0.2% -0.8% MEDICARE Expenditure (billions) $568.5 $588.9 $618.5 $648.8 $676.8 $705.1 $750.2 Expenditure growth 4.3% 3.6% 5.0% 4.9% 4.3% 4.2% 6.4% Per enrollee expenditure $11,441 $11,485 $11,704 $11,951 $12,137 $12,334 $12,784 Per enrollee expenditure growth 0.3% 0.4% 1.90 2.1% 1.6% 1.6% 3.7% Enrollment (millions) 49.7 51.3 52.8 543 55.8 57.2 58.7 Enrollment growth 4.1% 3.2% 3.1% 2.7% 2.7% 2.5% 2.6% MEDICAID Expenditure (billions) $422.9 $445.2 $497.8 $542.6 $565.4 $580.1 $597.4 Expenditure growth 4.0% 5.3% 11.8% 9.0% 4.2% 2.6% 3.0% Per enrollee expenditure $7,278 $7,536 $7,592 $7,835 $7,948 $8,041 $8,201 Per enrollee expenditure growth 0.6% 3.5% 0.7% 3.2% 1.4% 1.2% 2.0% Enrollment (millions) 58.1 59.1 65.6 69.3 71.1 72.1 728 Enrollment growth 3.3% 1.7% 11.0% 5.6% 2.7% 1.4% 1.0% UNINSURED AND POPULATION Uninsured (millions) 44.7 44.1 35.5 29.5 28.7 29.7 30.7 Uninsured growth -1.9% -1.4% -19.5% -17.0% -2.8% 3.7% 3.1% Population (mi 313.3 315.5 317.9 320.1 322.5 324.6 326.6 Population growth 0.7% 0.7% 0.7% 0.7% 0.8% 0.7% 0.6% Insured share of total population 85.7% 86.0% 88.8% 90.8% 91.1% 90.8% 90.6% SOURCES Centers for Medicare and Medicaid Services (CMS), Office of the Actuary, National Health Statistics Group; and Department of Commerce, Census Bureau. NOTES Definitions, sources, and methods for NHE categories can be found in Centers for Medicare and Medicaid Services. National Health Expenditure Accounts: methodology paper (see note 20 in text). Numbers might not add to totals because of rounding. Percent changes are calculated from unrounded data. "Annual growth, 2011-12. "Estimates are explained in exhibit 1 notes