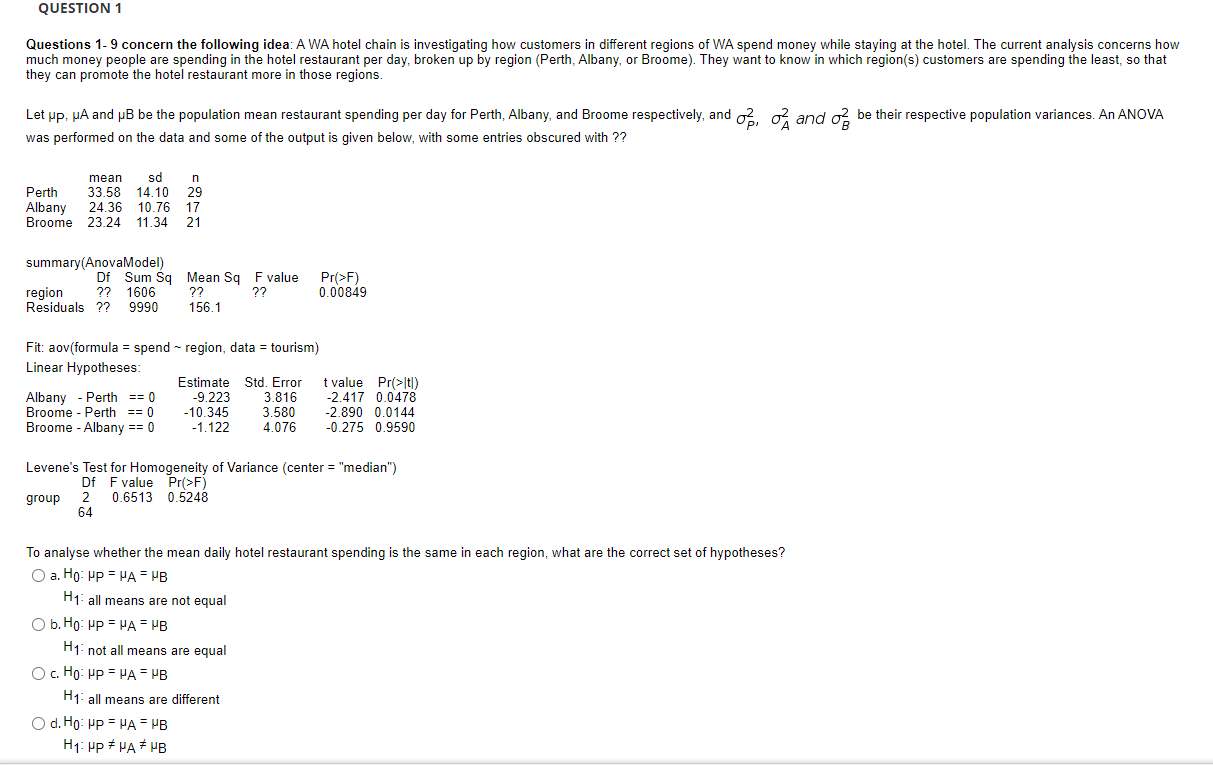
QUESTION 1 Questions 1-9 concern the following idea: A WA hotel chain is investigating how customers in different regions of WA spend money while staying
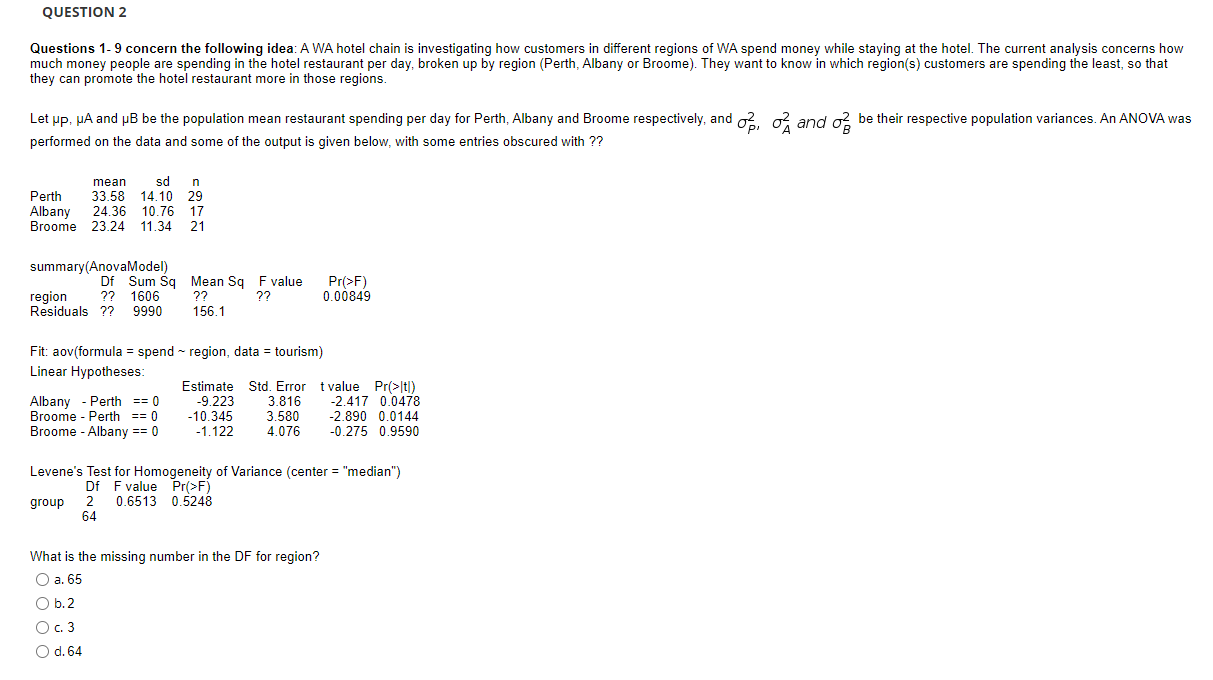
QUESTION 1 Questions 1-9 concern the following idea: A WA hotel chain is investigating how customers in different regions of WA spend money while staying at the hotel. The current analysis concerns how much money people are spending in the hotel restaurant per day, broken up by region (Perth, Albany, or Broome). They want to know in which region(s) customers are spending the least, so that they can promote the hotel restaurant more in those regions Let up, JA and pB be the population mean restaurant spending per day for Perth, Albany, and Broome respectively, and o2, o2 and o2 be their respective population variances. An ANOVA was performed on the data and some of the output is given below, with some entries obscured with ?? mean sd Perth 33.58 14.10 29 Albany 24.36 10.76 17 Broome 23.24 11.34 21 summary(AnovaModel) Of Sum Sq Mean Sq F value Pr(>F) region ?? 1606 ?? ?? 0.00849 Residuals ?? 9990 156.1 Fit: aov(formula = spend ~ region, data = tourism) Linear Hypotheses: Estimate Std. Error t value Pr(>It)) Albany - Perth == 0 -9.223 3.816 -2.417 0.0478 Broome - Perth == 0 -10.345 3.580 -2.890 0.0144 Broome - Albany == 0 -1.122 4.076 -0.275 0.9590 Levene's Test for Homogeneity of Variance (center = "median") f F value Pr(>F) group 2 0.6513 0.5248 64 To analyse whether the mean daily hotel restaurant spending is the same in each region, what are the correct set of hypotheses? O a. Ho: HP = HA = HB H1: all means are not equal O b. Ho: HP = HA = HB H1: not all means are equal O c. Ho: HP = HA = HB H1: all means are different O d. Ho: UP = HA = HB H1: UP # HA # HBQUESTION 2 Questions 1-9 concern the following idea: A WA hotel chain is investigating how customers in different regions of WA spend money while staying at the hotel. The current analysis concerns how much money people are spending in the hotel restaurant per day, broken up by region (Perth, Albany or Broome). They want to know in which region(s) customers are spending the least, so that they can promote the hotel restaurant more in those regions. Let up, JA and pB be the population mean restaurant spending per day for Perth, Albany and Broome respectively, and oz, o2 and o2 be their respective population variances. An ANOVA was performed on the data and some of the output is given below, with some entries obscured with ?? mean sd n Perth 33.58 14.10 29 Albany 24.36 10.76 17 Broome 23.24 11.34 21 summary(AnovaModel) Of Sum Sq Mean Sq F value Pr(>F) region ?? 1606 ?? ?? 0.00849 Residuals ?? 9990 156.1 Fit: aov(formula = spend ~ region, data = tourism) Linear Hypotheses: Estimate Std. Error tvalue Pr(>It]) Albany - Perth == 0 -9.223 3.816 -2.417 0.0478 Broome - Perth == 0 -10.345 3.580 -2.890 0.0144 Broome - Albany == 0 -1.122 4.076 -0.275 0.9590 Levene's Test for Homogeneity of Variance (center = "median") Df F value Pr( >F) group 2 0.6513 0.5248 64 What is the missing number in the DF for region? O a. 65 O b. 2 O c. 3 O d. 64
Step by Step Solution
There are 3 Steps involved in it
Step: 1
Get Instant Access to Expert-Tailored Solutions
See step-by-step solutions with expert insights and AI powered tools for academic success
Step: 2
Step: 3
Ace Your Homework with AI
Get the answers you need in no time with our AI-driven, step-by-step assistance