Answered step by step
Verified Expert Solution
Link Copied!

Question

1 Approved Answer

Question 1: Single mean Answers the follwing 7 questions separately and mention qyestion number for each answer: A sales manager is investigating the impact of

Question 1: Single mean Answers the follwing 7 questions separately and mention qyestion number for each answer:

A sales manager is investigating the impact of a newly implemented training plan in their department. Twelve members of the sales team were sent on a training programme while the rest were not.

A few months later, the sales manager compares the average monthly sales of the team members sent on the programme to the sales of those who did not attend the training. The sales manager decides to perform a hypothesis test to determine whether the training plan resulted in an increase in monthly sales, on average.

The average monthly sales figure for all team members who did not attend the training was 1,822.34 (treat this as the population mean).

The 12 team members who attended the training obtained the following sales figures:

image text in transcribedimage text in transcribedimage text in transcribedimage text in transcribedimage text in transcribed
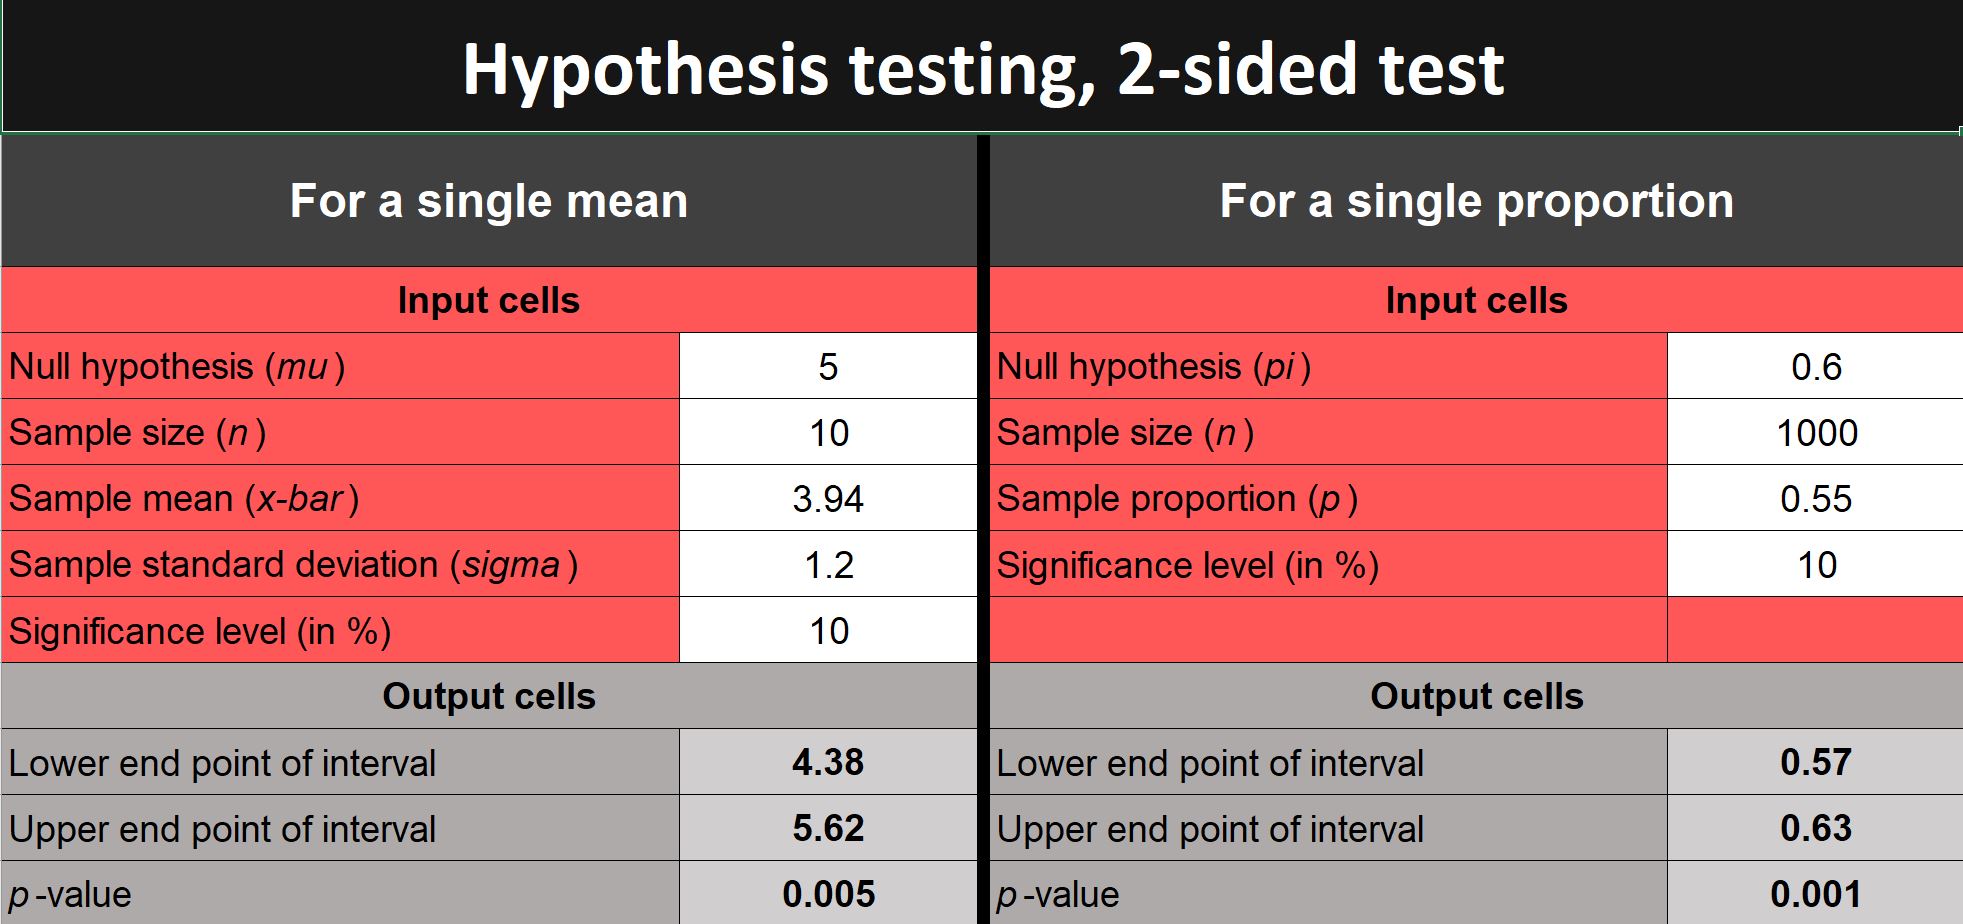
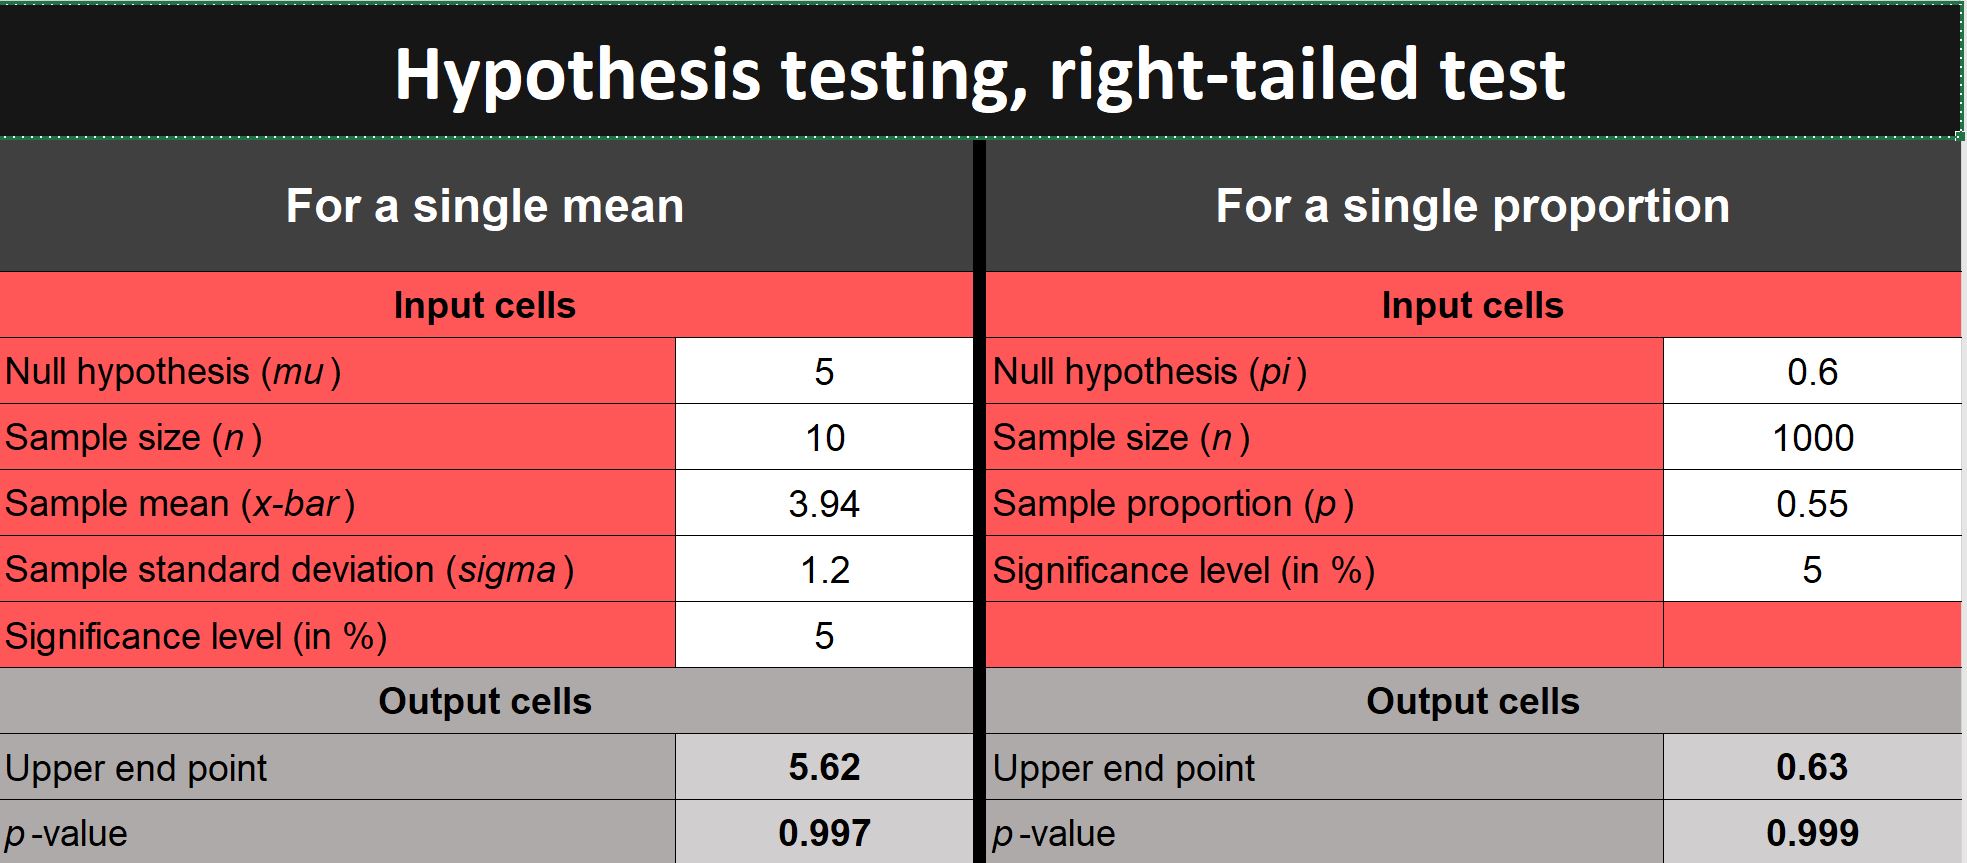
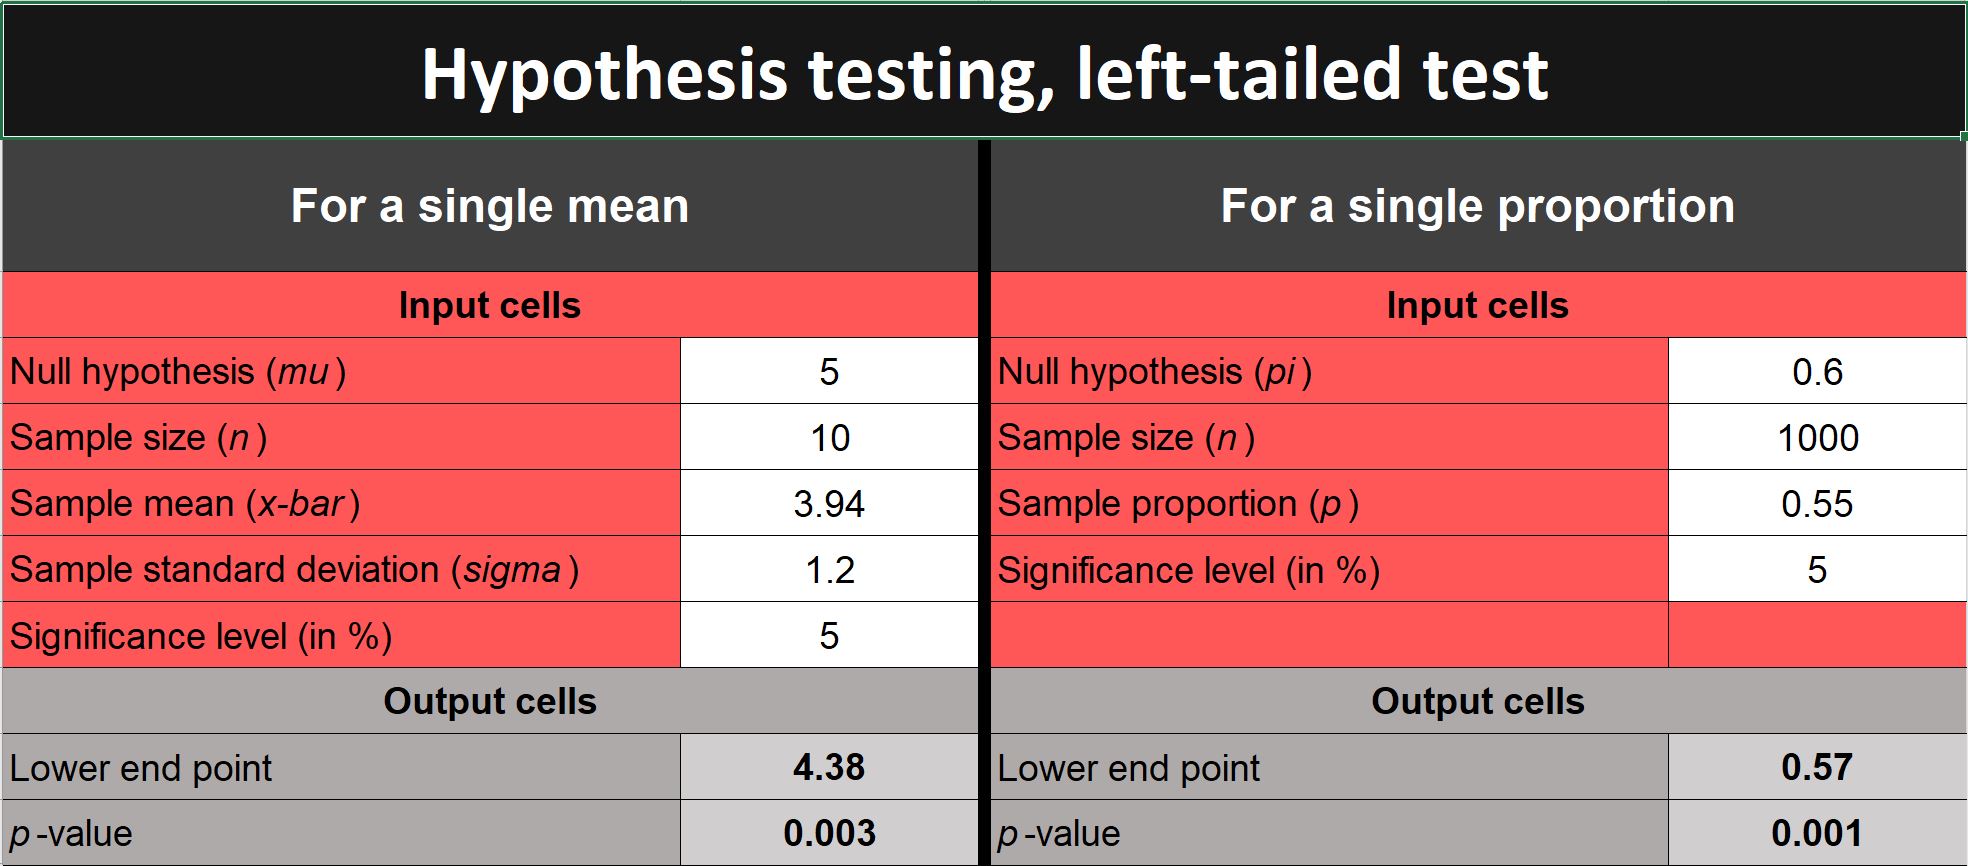
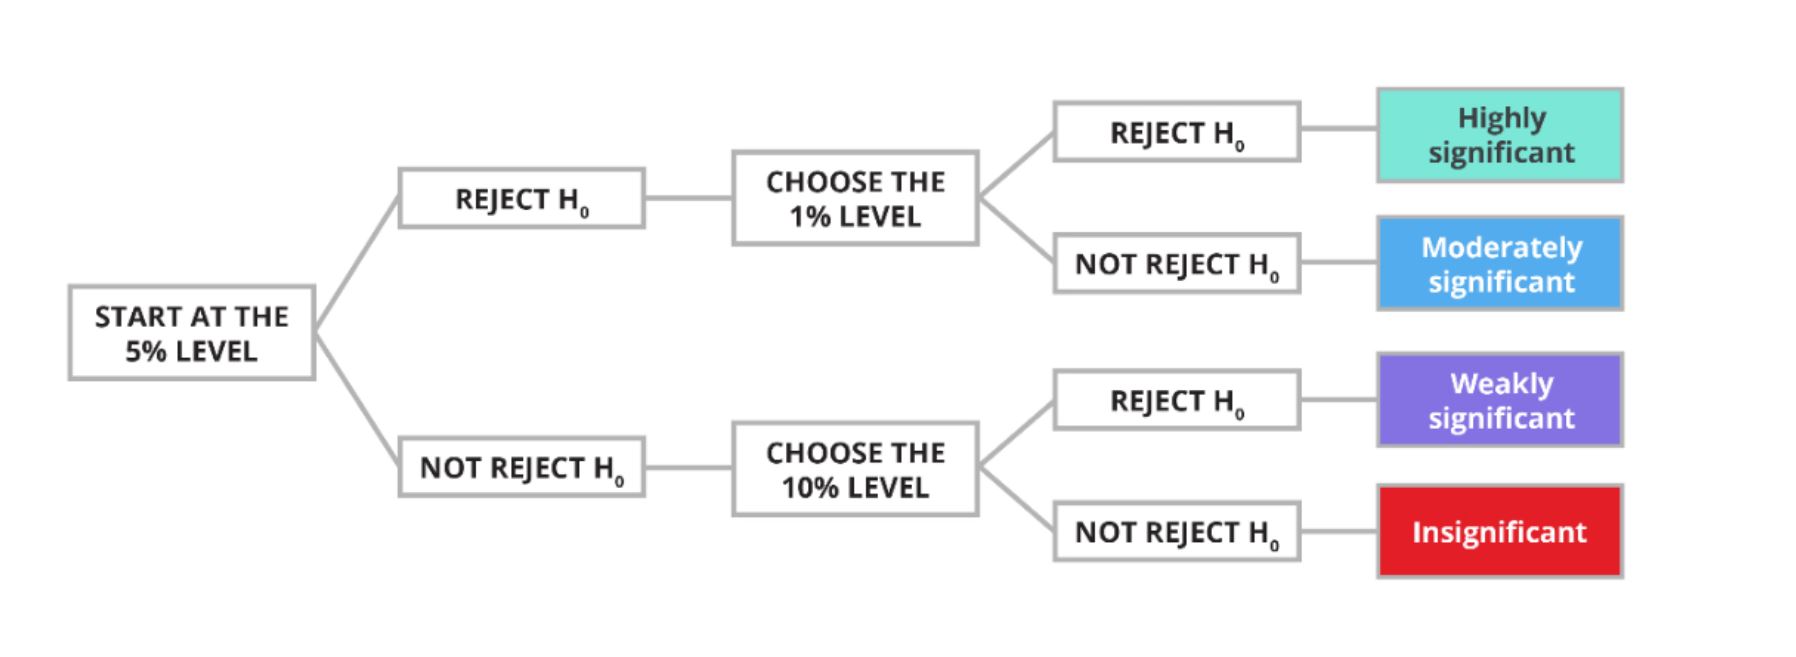
$2,232.90 $545.47 E3,440.70 E1,809.10 16,552.70 E4,789.70 $2,965.00 $2,610.70 E3,381.30 $1,591.40 12,376.20 $2, 191.00Hypothesis testing, 2-sided test For a single mean For a single proportion Input cells Input cells Null hypothesis (mu) 5 Null hypothesis (pi) 0.6 Sample size (n) 10 Sample size (n) 1000 Sample mean (x-bar) 3.94 Sample proportion (p ) 0.55 Sample standard deviation (sigma ) 1.2 Significance level (in %) 10 Significance level (in %) 10 Output cells Output cells Lower end point of interval 4.38 Lower end point of interval 0.57 Upper end point of interval 5.62 Upper end point of interval 0.63 p-value 0.005 p-value 0.001Hypothesis testing, right-tailed test For a single mean For a single proportion Input cells Input cells Null hypothesis (mu) 5 Null hypothesis (pi) 0.6 Sample size (n ) 10 Sample size (n) 1000 Sample mean (x-bar) 3.94 Sample proportion (p ) 0.55 Sample standard deviation (sigma ) 1.2 Significance level (in %) 5 Significance level (in %) 5 Output cells Output cells Upper end point 5.62 Upper end point 0.63 p-value 0.997 p-value 0.999Hypothesis testing, left-tailed test For a single mean For a single proportion Input cells Input cells Null hypothesis (mu ) Null hypothesis (pi) 0.6 Sample size (n) 10 Sample size (n) 1000 Sample mean (x-bar) 3.94 Sample proportion (p) 0.55 Sample standard deviation (sigma ) 1.2 Significance level (in %) 5 Significance level (in %) 5 Output cells Output cells Lower end point 4.38 Lower end point 0.57 p-value 0.003 p-value 0.001REJECT H. Highly significant CHOOSE THE REJECT H. 1% LEVEL NOT REJECT H. Moderately significant START AT THE 5% LEVEL REJECT H. Weakly significant NOT REJECT H. CHOOSE THE 10% LEVEL NOT REJECT H Insignificant

Step by Step Solution

There are 3 Steps involved in it

Step: 1

blur-text-image

Get Instant Access to Expert-Tailored Solutions

See step-by-step solutions with expert insights and AI powered tools for academic success

Step: 2

blur-text-image

Step: 3

blur-text-image

Ace Your Homework with AI

Get the answers you need in no time with our AI-driven, step-by-step assistance

Get Started

Recommended Textbook for

Algebra And Trigonometry

Authors: Cynthia Y Young

5th Edition

1119820898, 9781119820895

More Books

Students also viewed these Mathematics questions