

Question
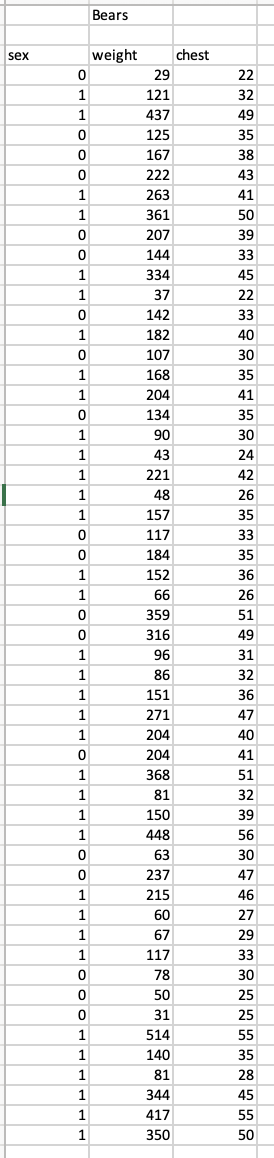
Question #1 : The file Bears.csv contains data collected on bears in a field study: chest is chest girth in inches, weight is bear weight
Question #1: The file Bears.csv contains data collected on bears in a field study: chest is chest girth in inches, weight is bear weight in pounds, and sex is a numerical coding of the animal's sex (male = 1, female = 0). Interest lies in the relationship between weight and chest girth.
a) Make a scatterplot of weight (y-axis) versus chest girth (x-axis) using a different color or symbol for the two sexes.
b) What is the form, strength, and direction of the relationship? Does the pattern of the relationship differ between sexes? How do the male bears as a group differ from the female bears as a group?
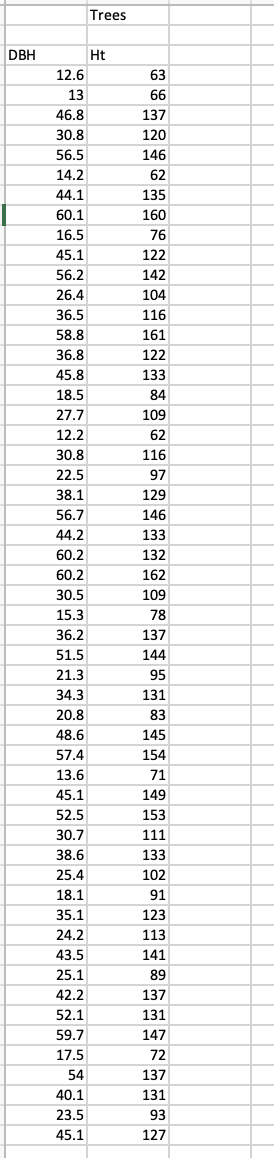
Question #2: Tree height is time-consuming to measure accurately. Tree diameter is easy to measure accurately. The file Trees.csv contains observations on height (Ht in feet) and diameter (DBH in inches) for a sample of trees. Interest lies in the relationship between height (as a response) and DBH (as an explanatory variable or predictor).
a) Graph the data appropriately given the interest specified (correct variables on axes). Can the relationship be considered, at least tentatively, linear? Explain.
b) Compute the correlation coefficient between height and DBH (if you rejected linearity in a), just "play along").
c) Obtain the least squares (simple linear) regression of height on DBH (again, "play along" if necessary). Identify the estimates of slope and intercept and state their units.
d) What is the coefficient of determination for the regression in c)? What does the value mean? Verify the known relationship between the coefficient of determination and the correlation coefficient (given this is a simple linear regression) by comparing the two numbers.
e) Plot the standardized residuals from the regression in c) against DBH (or equivalently fitted values). Do you see any issues?
Question #3: Continuing question #2, it has been suggested that transforming height to the natural logarithm of height and DBH to inverse of DBH results in a "more linear" relationship. Using ln(Ht) and (1/DBH) for the response and explanatory variables, respectively, answer the following questions:
f) Obtain the least squares (simple linear) regression of ln(Ht) on 1/DBH (Hint: make two new columns, one labeled "ln(Ht)" and the other "1/DBH"; use these new columns when fitting your regression).
g) What is the coefficient of determination for the regression in f)?
h) Plot the standardized residuals from the regression in f) against 1/DBH (or equivalently fitted values). Do you see any issues?
i) Explain why the slope of this relationship is negative.
j) Do you agree or disagree that transforming the variables is the appropriate thing to do in this case? Explain.

Step by Step Solution
There are 3 Steps involved in it
Step: 1

Get Instant Access to Expert-Tailored Solutions
See step-by-step solutions with expert insights and AI powered tools for academic success
Step: 2

Step: 3
Ace Your Homework with AI
Get the answers you need in no time with our AI-driven, step-by-step assistance
Get Started
Bridging Algebra, Geometry, And Topology
Authors: Denis Ibadula, Willem Veys
1st Edition
3319091867, 9783319091860