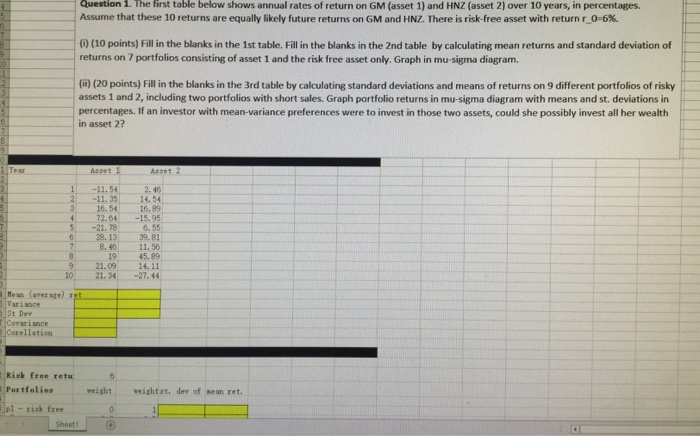
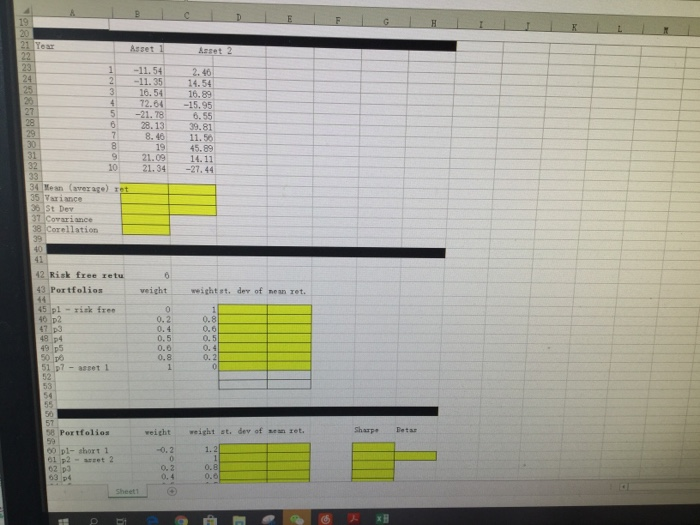
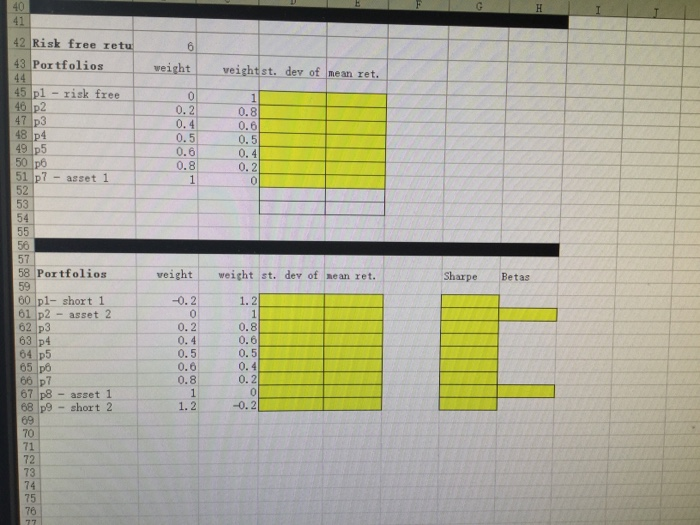
Question 1. The first table below shows annual rates of return on GM (asset 1) and HNZ (asset 2) over 10 years, in percentages. Assume that these 10 returns are equally likely future returns on GM and HNZ. There is risk-free asset with return r 0-6%. 0) (10 points) Fill in the blanks in the 1st table. Fill in the blanks in the 2nd table by calculating mean returns and standard deviation of returns on 7 portfolios consisting of asset 1 and the risk free asset only. Graph in mu-sigma diagram. (i) (20 points) Fill in the blanks in the 3rd table by calculating standard deviations and means of returns on 9 different portfolios of risky assets 1 and 2, including two portfolios with short sales. Graph portfolio returns in mu-sigma diagram with means and st. deviations in percentages. If an investor with mean-variance preferences were to invest in those two assets, could she possibly invest all her wealth in asset 2? 2. 46 2-11.35 14. 54 316.54 16.89 72.04. -15.95 6. 55 28.13 39.81 8. 4011.50 19 45.89 921.09 14.11 1021.34-27.44 11.54 5 -21.78 Variance St Dev Covariance orellation Risk free retu Portfolios weight weightst, dev of nean ret. p1- risk free Sheet1 1-11.54 2( 11. 351, 14, 54 -16. 54-16. 89 -72. 64| 15, 95 51-21. 78--6. 55 6 28.13 39.81 8.46 11.50 19 45.89 9 21.09 14. 11 _101_-21. 34[--27. 34 Mean (average) r 35 Variance Covariance 8 Corellation 2 Risk free retu 43 Portfolios 45 pl -rizk free veight weight et. der of nean ret. 0.2 0.4 0.5 0.0 0.8 0.8 0.6 0. 5 0. 4 0.2 48 51 p7- asset 1 54 50 57 58 Portfolios Sharpe etar veight weight st. dev of sean zet. -0.2 1.2 o. 2 0. 4 0.8 o.6 02 p3 41 42Risk free retur 43 Portfolios 45 pl- risk free 1 weight veightst. dev of mean ret. 0.2 0.4 0.5 0.6 0.8 0.8 0.6 0. 5 0. 4 51 p -asset l 54 58 Portfolios veightweight st. dev of nean ret. SharpeBetas -0.21.2 60 pl- short 1 61 p2 - asset 2 62 p3 63 p4 64 p5 0. 2 0. 4 0.5 0.6 0.8 0.8 0.6 0. 5 0.4 0.2 66 p7 67 p8 - asset 1 68 p9 short 2 1.2 71 72 73 74 75 Question 1. The first table below shows annual rates of return on GM (asset 1) and HNZ (asset 2) over 10 years, in percentages. Assume that these 10 returns are equally likely future returns on GM and HNZ. There is risk-free asset with return r 0-6%. 0) (10 points) Fill in the blanks in the 1st table. Fill in the blanks in the 2nd table by calculating mean returns and standard deviation of returns on 7 portfolios consisting of asset 1 and the risk free asset only. Graph in mu-sigma diagram. (i) (20 points) Fill in the blanks in the 3rd table by calculating standard deviations and means of returns on 9 different portfolios of risky assets 1 and 2, including two portfolios with short sales. Graph portfolio returns in mu-sigma diagram with means and st. deviations in percentages. If an investor with mean-variance preferences were to invest in those two assets, could she possibly invest all her wealth in asset 2? 2. 46 2-11.35 14. 54 316.54 16.89 72.04. -15.95 6. 55 28.13 39.81 8. 4011.50 19 45.89 921.09 14.11 1021.34-27.44 11.54 5 -21.78 Variance St Dev Covariance orellation Risk free retu Portfolios weight weightst, dev of nean ret. p1- risk free Sheet1 1-11.54 2( 11. 351, 14, 54 -16. 54-16. 89 -72. 64| 15, 95 51-21. 78--6. 55 6 28.13 39.81 8.46 11.50 19 45.89 9 21.09 14. 11 _101_-21. 34[--27. 34 Mean (average) r 35 Variance Covariance 8 Corellation 2 Risk free retu 43 Portfolios 45 pl -rizk free veight weight et. der of nean ret. 0.2 0.4 0.5 0.0 0.8 0.8 0.6 0. 5 0. 4 0.2 48 51 p7- asset 1 54 50 57 58 Portfolios Sharpe etar veight weight st. dev of sean zet. -0.2 1.2 o. 2 0. 4 0.8 o.6 02 p3 41 42Risk free retur 43 Portfolios 45 pl- risk free 1 weight veightst. dev of mean ret. 0.2 0.4 0.5 0.6 0.8 0.8 0.6 0. 5 0. 4 51 p -asset l 54 58 Portfolios veightweight st. dev of nean ret. SharpeBetas -0.21.2 60 pl- short 1 61 p2 - asset 2 62 p3 63 p4 64 p5 0. 2 0. 4 0.5 0.6 0.8 0.8 0.6 0. 5 0.4 0.2 66 p7 67 p8 - asset 1 68 p9 short 2 1.2 71 72 73 74 75


