

Answered step by step
Verified Expert Solution
Question
1 Approved Answer
Question 1 The management of a company is considering replacing a number of old looms in the mill's weave room. The looms to be replaced
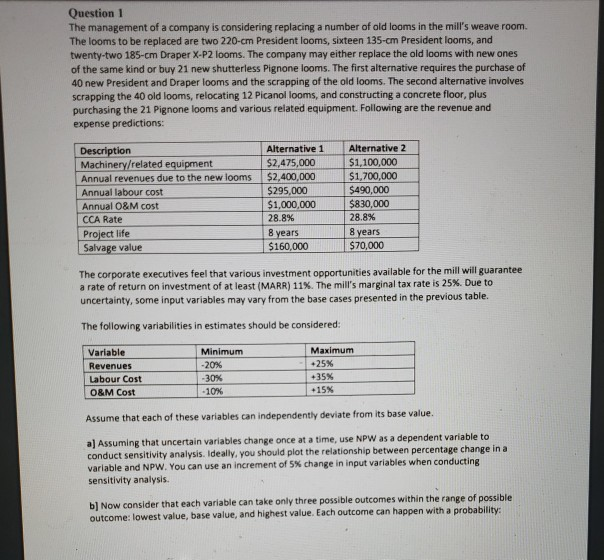
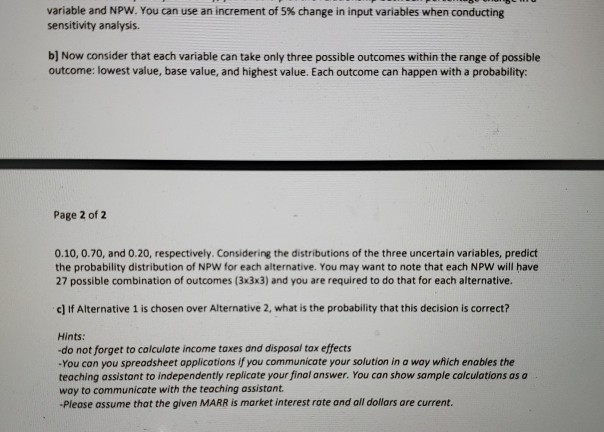
Question 1 The management of a company is considering replacing a number of old looms in the mill's weave room. The looms to be replaced are two 220-cm President looms, sixteen 135-cm President looms, and twenty-two 185-cm Draper X-P2 looms. The company may either replace the old looms with new ones of the same kind or buy 21 new shutterless Pignone looms. The first alternative requires the purchase of 40 new President and Draper looms and the scrapping of the old looms. The second alternative involves scrapping the 40 old looms, relocating 12 Picanol looms, and constructing a concrete floor, plus purchasing the 21 Pignone looms and various related equipment. Following are the revenue and expense predictions: Description Machinery/related equipment Annual revenues due to the new looms Annual labour cost Annual O&M cost CCA Rate Project life Salvage value Alternative 1 $2,475,000 $2,400,000 $295,000 $1,000,000 28.8% 8 years $160,000 Alternative 2 $1,100,000 $1,700,000 $490,000 $830,000 28.8% 8 years $70,000 The corporate executives feel that various investment opportunities available for the mill will guarantee a rate of return on investment of at least (MARR) 11%. The mill's marginal tax rate is 25%. Due to uncertainty, some input variables may vary from the base cases presented in the previous table. The following variabilities in estimates should be considered: Variable Revenues Labour Cost O&M Cost Minimum -20% -30% -10% Maximum +25% +35% +15% Assume that each of these variables can independently deviate from its base value. a) Assuming that uncertain variables change once at a time, use NPW as a dependent variable conduct sensitivity analysis. Ideally, you should plot the relationship between percentage change in a variable and NPW. You can use an increment of 5% change in input variables when conducting sensitivity analysis. b) Now consider that each variable can take only three possible outcomes within the range of possible outcome: lowest value, base value, and highest value. Each outcome can happen with a probability: variable and NPW. You can use an increment of 5% change in input variables when conducting sensitivity analysis. b] Now consider that each variable can take only three possible outcomes within the range of possible outcome: lowest value, base value, and highest value. Each outcome can happen with a probability: Page 2 of 2 0.10,0.70, and 0.20, respectively. Considering the distributions of the three uncertain variables, predict the probability distribution of NPW for each alternative. You may want to note that each NPW will have 27 possible combination of outcomes (3x3x3) and you are required to do that for each alternative. c) If Alternative 1 is chosen over Alternative 2, what is the probability that this decision is correct? Hints: -do not forget to calculate income taxes and disposal tox effects - You can you spreadsheet applications if you communicate your solution in a way which enables the teaching assistant to independently replicate your final answer. You can show sample calculations as a way to communicate with the teaching assistant -Please assume that the given MARR is market interest rate and all dollars are current. Question 1 The management of a company is considering replacing a number of old looms in the mill's weave room. The looms to be replaced are two 220-cm President looms, sixteen 135-cm President looms, and twenty-two 185-cm Draper X-P2 looms. The company may either replace the old looms with new ones of the same kind or buy 21 new shutterless Pignone looms. The first alternative requires the purchase of 40 new President and Draper looms and the scrapping of the old looms. The second alternative involves scrapping the 40 old looms, relocating 12 Picanol looms, and constructing a concrete floor, plus purchasing the 21 Pignone looms and various related equipment. Following are the revenue and expense predictions: Description Machinery/related equipment Annual revenues due to the new looms Annual labour cost Annual O&M cost CCA Rate Project life Salvage value Alternative 1 $2,475,000 $2,400,000 $295,000 $1,000,000 28.8% 8 years $160,000 Alternative 2 $1,100,000 $1,700,000 $490,000 $830,000 28.8% 8 years $70,000 The corporate executives feel that various investment opportunities available for the mill will guarantee a rate of return on investment of at least (MARR) 11%. The mill's marginal tax rate is 25%. Due to uncertainty, some input variables may vary from the base cases presented in the previous table. The following variabilities in estimates should be considered: Variable Revenues Labour Cost O&M Cost Minimum -20% -30% -10% Maximum +25% +35% +15% Assume that each of these variables can independently deviate from its base value. a) Assuming that uncertain variables change once at a time, use NPW as a dependent variable conduct sensitivity analysis. Ideally, you should plot the relationship between percentage change in a variable and NPW. You can use an increment of 5% change in input variables when conducting sensitivity analysis. b) Now consider that each variable can take only three possible outcomes within the range of possible outcome: lowest value, base value, and highest value. Each outcome can happen with a probability: variable and NPW. You can use an increment of 5% change in input variables when conducting sensitivity analysis. b] Now consider that each variable can take only three possible outcomes within the range of possible outcome: lowest value, base value, and highest value. Each outcome can happen with a probability: Page 2 of 2 0.10,0.70, and 0.20, respectively. Considering the distributions of the three uncertain variables, predict the probability distribution of NPW for each alternative. You may want to note that each NPW will have 27 possible combination of outcomes (3x3x3) and you are required to do that for each alternative. c) If Alternative 1 is chosen over Alternative 2, what is the probability that this decision is correct? Hints: -do not forget to calculate income taxes and disposal tox effects - You can you spreadsheet applications if you communicate your solution in a way which enables the teaching assistant to independently replicate your final answer. You can show sample calculations as a way to communicate with the teaching assistant -Please assume that the given MARR is market interest rate and all dollars are current
Step by Step Solution
There are 3 Steps involved in it
Step: 1

Get Instant Access to Expert-Tailored Solutions
See step-by-step solutions with expert insights and AI powered tools for academic success
Step: 2

Step: 3
Ace Your Homework with AI
Get the answers you need in no time with our AI-driven, step-by-step assistance
Get Started
Information Systems Audit In Banking Sector A Study Of SBI And ICICI Banks
Authors: C. Mallesha, M. Sulochana
1st Edition
6200254397, 978-6200254399