

Answered step by step
Verified Expert Solution
Question
1 Approved Answer
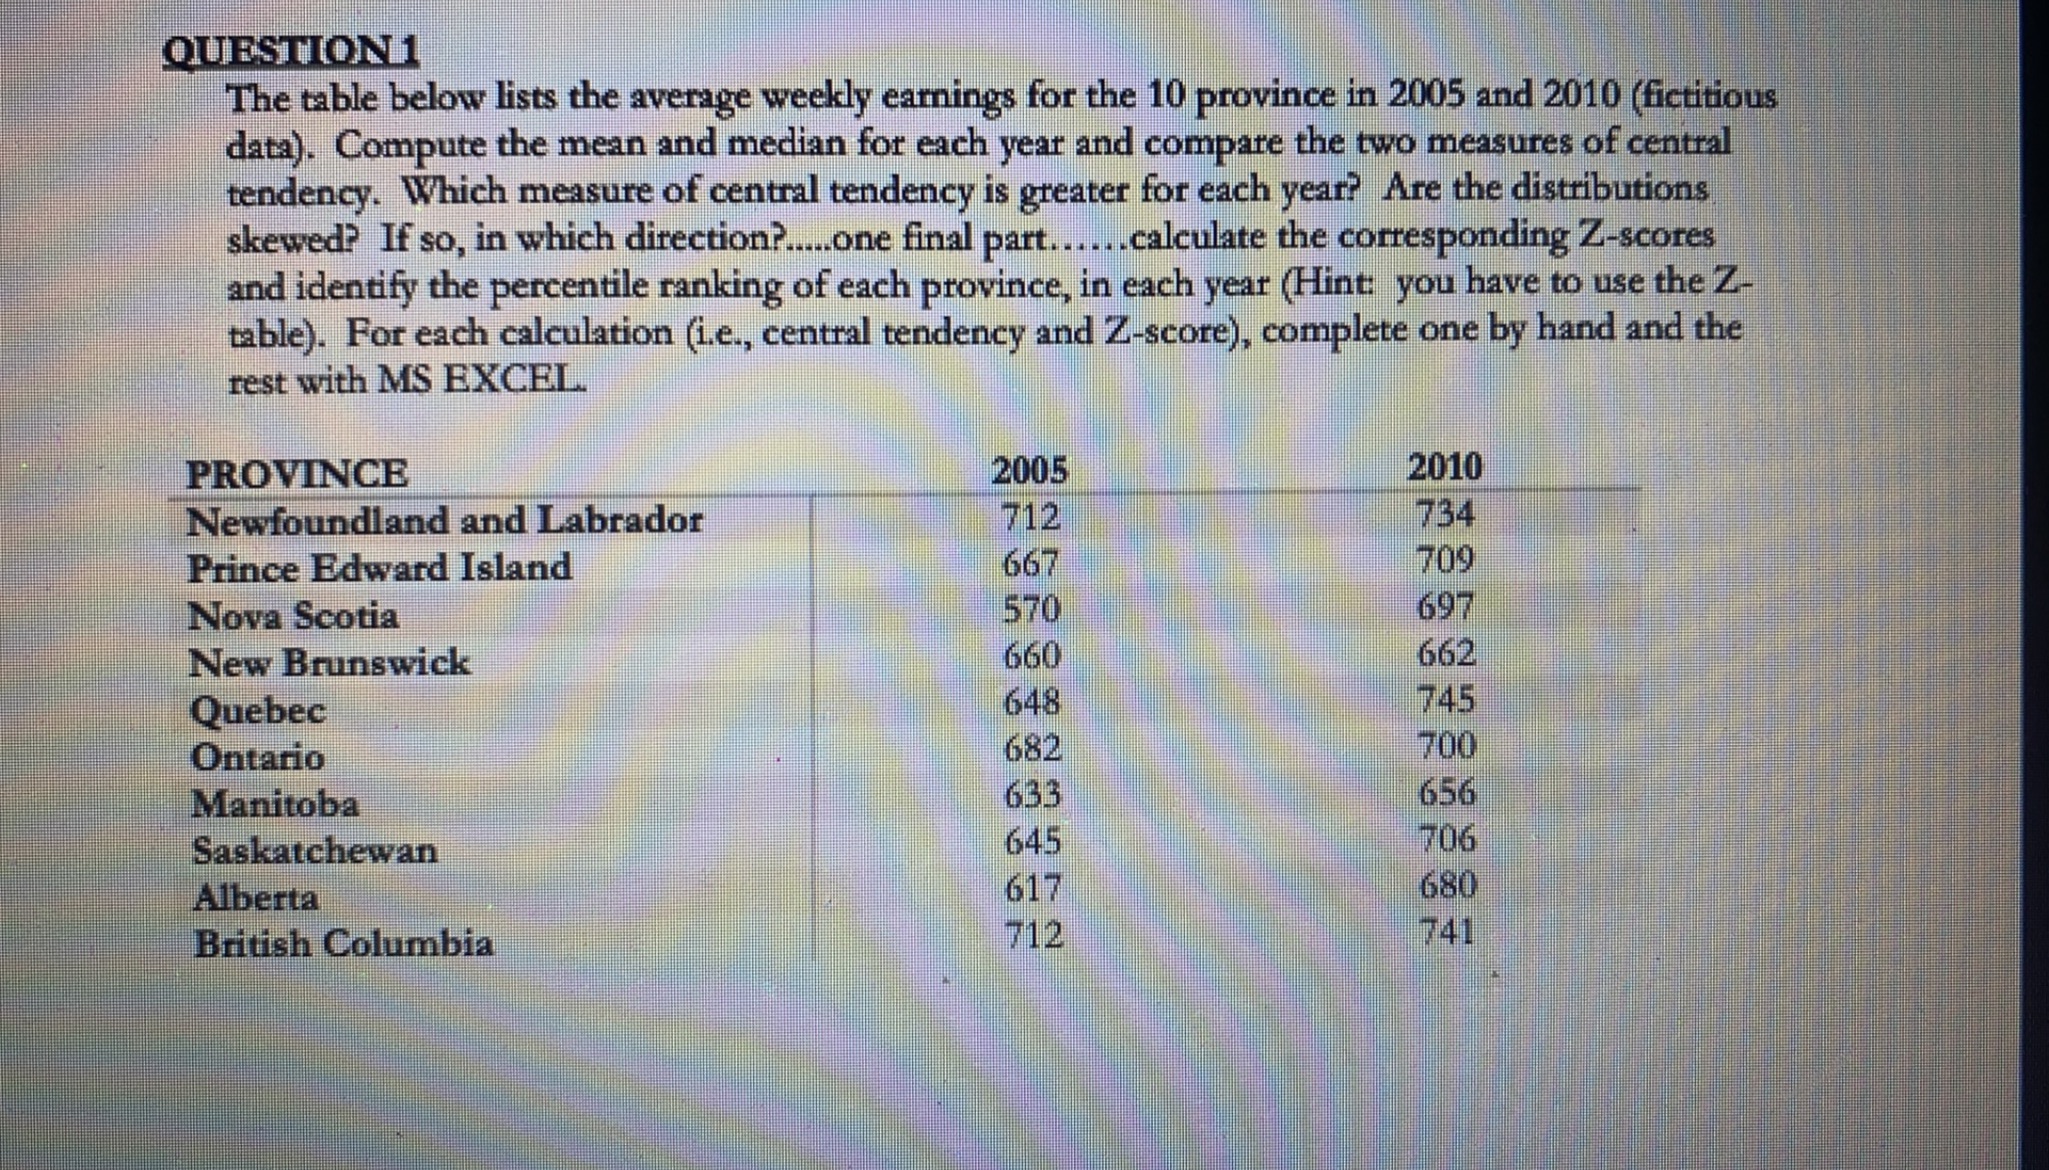
QUESTION 1 The table below lists the average weekly earnings for the 10 province in 2005 and 2010 (fictitious data). Compute the mean and median
Step by Step Solution
There are 3 Steps involved in it
Step: 1

Get Instant Access to Expert-Tailored Solutions
See step-by-step solutions with expert insights and AI powered tools for academic success
Step: 2

Step: 3
Ace Your Homework with AI
Get the answers you need in no time with our AI-driven, step-by-step assistance
Get Started
Finite Math And Applied Calculus
Authors: Stefan Waner, Steven Costenoble
6th Edition
1285415132, 9781285415130