Question
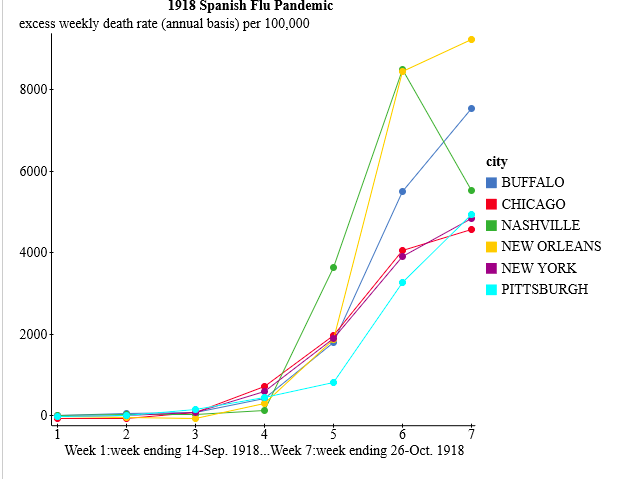
Question 1 . The weekly excess death rate for each city is the sample mean of the data from several reporting stations (hospitals, clinics, etc.)
Question 1. The weekly excess death rate for each city is the sample mean of the data from several reporting stations (hospitals, clinics, etc.) within a 50 mile radius of the city. Determine the 95% CI for the mean week 7 excess death rate in the city with the highest reported week 7 excess death rate. Assume this city receives data from n = 38 reporting stations and that the sample standard deviation s = 463.
lower bound
upper bound
Are the New York City and Pittsburgh mean week 7 excess death rates significantly different? Perform a 2-tail hypothesis test for mu(NYC)- mu(PITT). Assume n(NYC) = 50, n(Pitt) = 35, s(NYC) = 239, s(Pitt) = 214. DO NOT use the approximation minimum(n1-1, n2-1) for the degrees of freedom.
Question 2a. What is the value of the test statistic for this hypothesis test?
Question 2b. Select the correct choice concerning the P-value for this hypothesis test.
P-value?0.0001
0.001?P-value?.01
P-value?0.05
0.02?P-value?0.04
0.10?P-value?0.15
Question 2c. What is the correct conclusion for this hypothesis test?
Reject the null hypothesis and conclude that the mean week 7 excess death rates are different. There is evidence that Pittsburgh's mean week 7 death rate is higher than New York's.
Do not reject the null hypothesis; there is no significant difference in the mean week 7 excess death rates.
Accept the null hypothesis; the mean week 7 excess death rates are equal.
Reject the null hypothesis and conclude that the mean week 7 excess death rates are not significantly different.

Step by Step Solution
There are 3 Steps involved in it
Step: 1

Get Instant Access to Expert-Tailored Solutions
See step-by-step solutions with expert insights and AI powered tools for academic success
Step: 2

Step: 3

Ace Your Homework with AI
Get the answers you need in no time with our AI-driven, step-by-step assistance
Get Started


