

Answered step by step
Verified Expert Solution
Question
1 Approved Answer
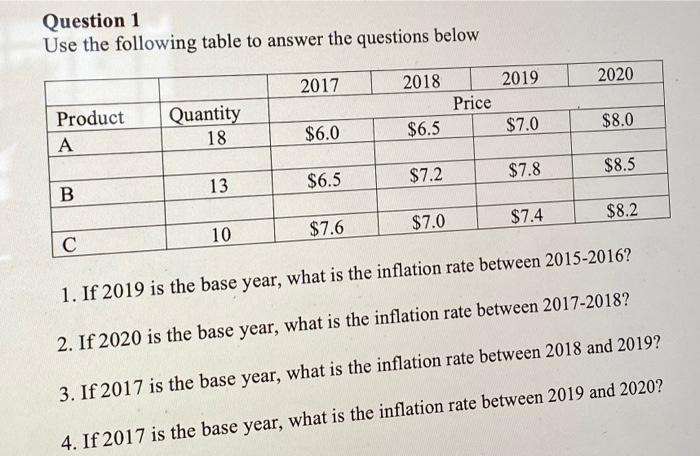
Question 1 Use the following table to answer the questions below 2018 2019 2017 2020 Price Product Quantity 18 $7.0 $8.0 $6.5 $6.0 A $7.8
Step by Step Solution
There are 3 Steps involved in it
Step: 1

Get Instant Access to Expert-Tailored Solutions
See step-by-step solutions with expert insights and AI powered tools for academic success
Step: 2

Step: 3
Ace Your Homework with AI
Get the answers you need in no time with our AI-driven, step-by-step assistance
Get Started
The Business Of Finance
Authors: Withers Hartley 1867 1950
1st Edition
1313069299, 9781313069298