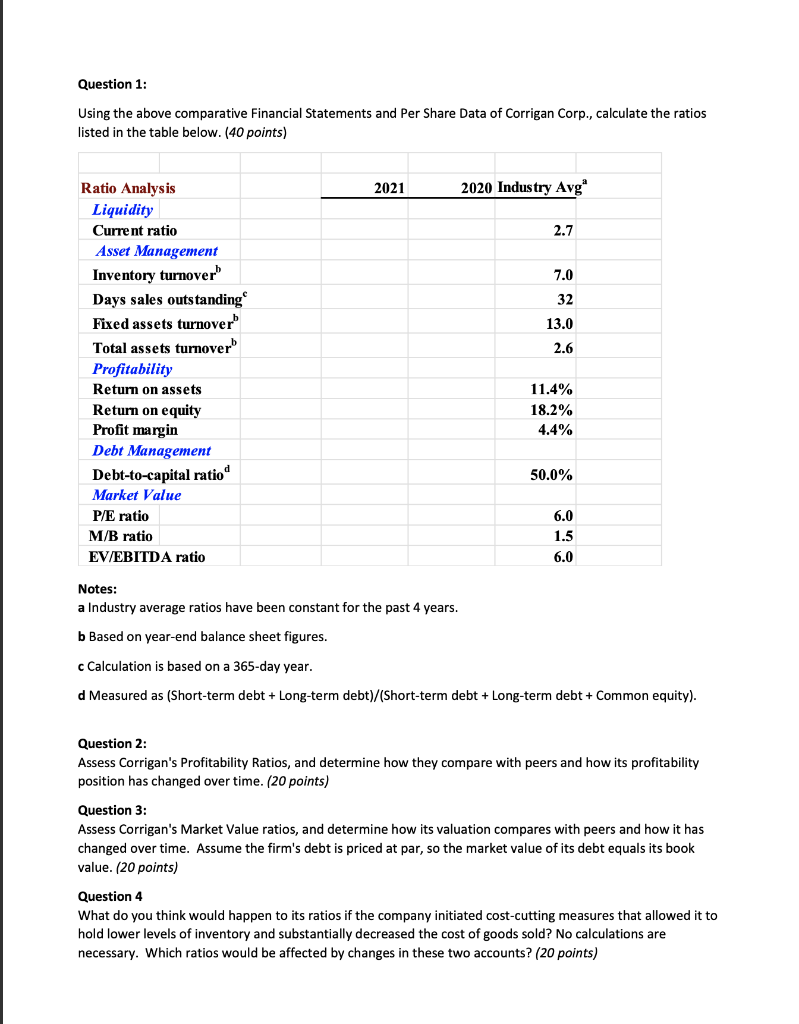
Question 1: Using the above comparative Financial Statements and Per Share Data of Corrigan Corp., calculate the ratios listed in the table below. (40 points) Ratio Analysis 2021 2020 Industry Avg" Liquidity Current ratio 2.7 Asset Management Inventory turnover 7.0 Days sales outstanding 32 Fixed assets turnover 13.0 Total assets turnoverb 2.6 Profitability Return on assets 11.4% 18.2% Return on equity Profit margin 4.4% Debt Management Debt-to-capital ratio 50.0% Market Value P/E ratio M/B ratio 6.0 1.5 6.0 EV/EBITDA ratio Notes: a Industry average ratios have been constant for the past 4 years. b Based on year-end balance sheet figures. c Calculation is based on a 365-day year. d Measured as (Short-term debt + Long-term debt)/(Short-term debt + Long-term debt + Common equity). Question 2: Assess Corrigan's Profitability Ratios, and determine how they compare with peers and how its profitability position has changed over time. (20 points) Question 3: Assess Corrigan's Market Value ratios, and determine how its valuation compares with peers and how it has changed over time. Assume the firm's debt is priced at par, so the market value of its debt equals its book value. (20 points) Question 4 What do you think would happen to its ratios if the company initiated cost-cutting measures that allowed it to hold lower levels of inventory and substantially decreased the cost of goods sold? No calculations are necessary. Which ratios would be affected by changes in these two accounts? (20 points) Question 1: Using the above comparative Financial Statements and Per Share Data of Corrigan Corp., calculate the ratios listed in the table below. (40 points) Ratio Analysis 2021 2020 Industry Avg" Liquidity Current ratio 2.7 Asset Management Inventory turnover 7.0 Days sales outstanding 32 Fixed assets turnover 13.0 Total assets turnoverb 2.6 Profitability Return on assets 11.4% 18.2% Return on equity Profit margin 4.4% Debt Management Debt-to-capital ratio 50.0% Market Value P/E ratio M/B ratio 6.0 1.5 6.0 EV/EBITDA ratio Notes: a Industry average ratios have been constant for the past 4 years. b Based on year-end balance sheet figures. c Calculation is based on a 365-day year. d Measured as (Short-term debt + Long-term debt)/(Short-term debt + Long-term debt + Common equity). Question 2: Assess Corrigan's Profitability Ratios, and determine how they compare with peers and how its profitability position has changed over time. (20 points) Question 3: Assess Corrigan's Market Value ratios, and determine how its valuation compares with peers and how it has changed over time. Assume the firm's debt is priced at par, so the market value of its debt equals its book value. (20 points) Question 4 What do you think would happen to its ratios if the company initiated cost-cutting measures that allowed it to hold lower levels of inventory and substantially decreased the cost of goods sold? No calculations are necessary. Which ratios would be affected by changes in these two accounts? (20 points)