

Question
Question 1 Using the historical data as a guide (Exhibit 6.1), construct a pro forma (forecasted) profit and loss statement for the clinic's average month
Question 1
Using the historical data as a guide (Exhibit 6.1), construct a pro forma (forecasted) profit and loss statement for the clinic's average month for all of 2010 assuming the status quo. With no change in volume (utilization), is the clinic projected to make a profit?
Question 2
Now consider the clinic's situation without the new marketing program. How many additional daily visits must be generated to break even? Construct a break-even graph that can be included in your report
Question 4
How many incremental daily visits must the program generate to make it worthwhile? (In other words, how many incremental visits would it take to pay for the marketing program, irrespective of overall clinic profitability?) Construct a graph showing the expected profitability of the proposed program versus incremental daily visits.
5. Recast the pro forma (forecasted) profit and loss statement developed in Question 1 for an average month in 2015, five years hence, assuming that volume is constant over time
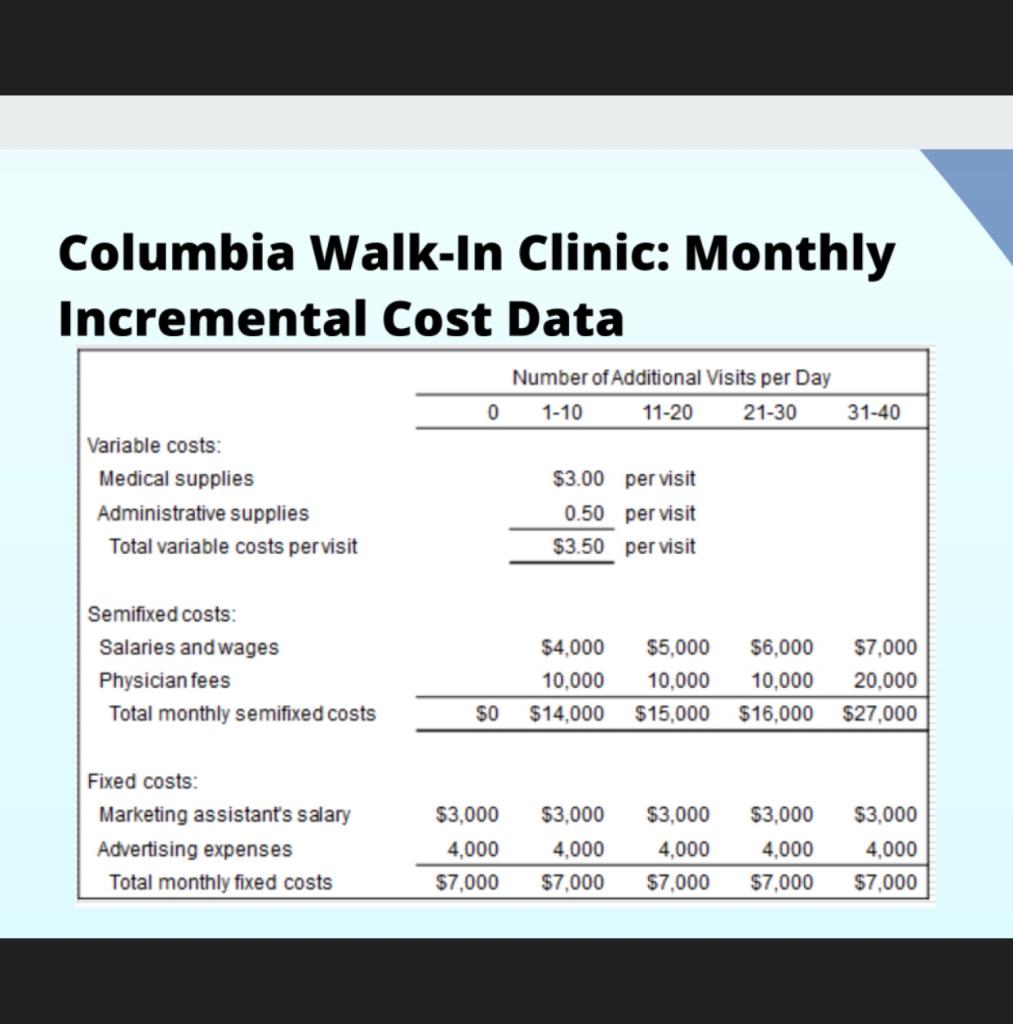
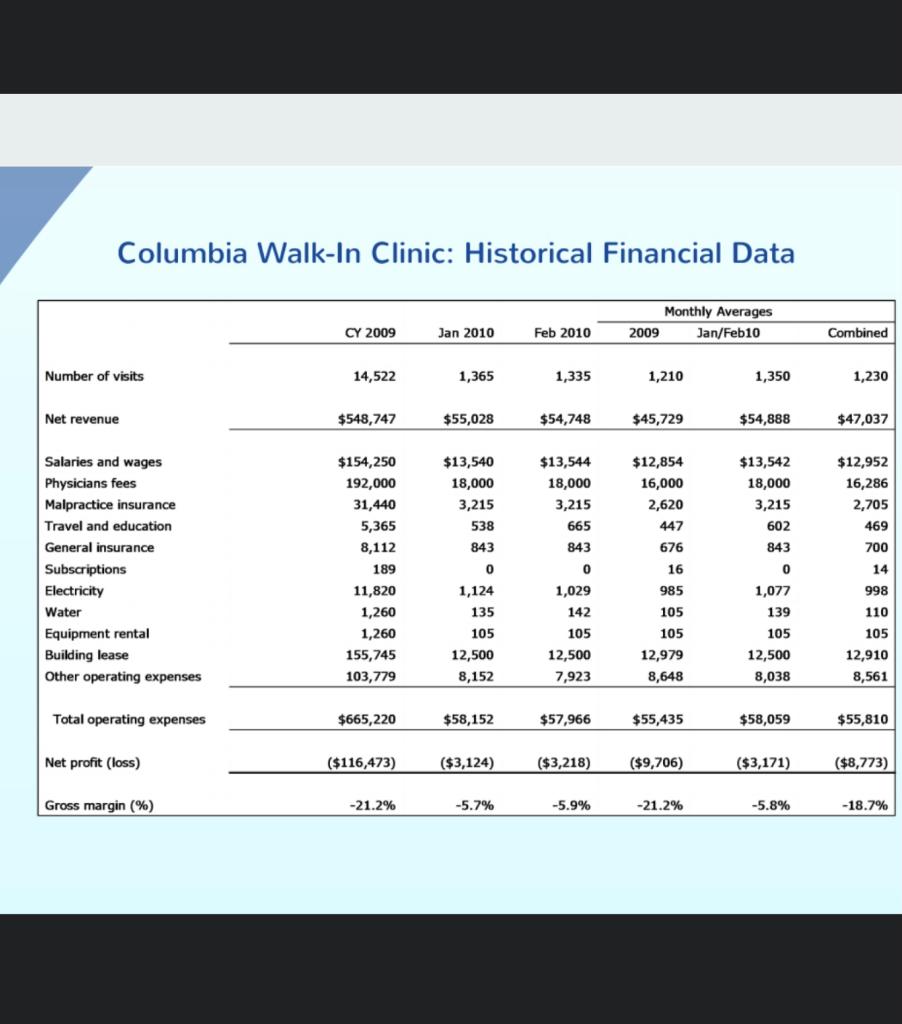
Columbia Walk-In Clinic: Monthly Incremental Cost Data Number of Additional Visits per Day 1-10 11-20 21-30 0 31-40 Variable costs: Medical supplies Administrative supplies Total variable costs per visit $3.00 per visit 0.50 per visit $3.50 per visit Semifixed costs: Salaries and wages Physician fees Total monthly semifixed costs $4,000 10.000 $14,000 $5,000 10,000 $15,000 $6,000 10,000 $16,000 $7,000 20,000 $27,000 $0 Fixed costs: Marketing assistant's salary Advertising expenses Total monthly fixed costs $3,000 4,000 $7,000 $3,000 4,000 $7,000 $3,000 4,000 $7,000 $3,000 4,000 $7,000 $3,000 4,000 $7,000 Columbia Walk-In Clinic: Historical Financial Data Monthly Averages 2009 Jan/Feb10 CY 2009 Jan 2010 Feb 2010 Combined Number of visits 14,522 1,365 1,335 1,210 1,350 1,230 Net revenue $548,747 $55,028 $54,748 $45,729 $54,888 $47,037 $13,540 18,000 3,215 538 843 $13,542 18,000 3,215 602 843 $12,952 16,286 2,705 469 700 Salaries and wages Physicians fees Malpractice insurance Travel and education General insurance Subscriptions Electricity Water Equipment rental Building lease Other operating expenses $154,250 192,000 31,440 5,365 8,112 189 11,820 1,260 1,260 155,745 103,779 0 $13,544 18,000 3,215 665 843 0 1,029 142 105 12,500 7,923 0 14 16,000 2,620 447 676 16 985 105 105 12,979 8,648 1,124 135 105 12,500 8,152 1,077 139 105 12,500 8,038 998 110 105 12,910 8,561 Total operating expenses $665,220 $58,152 $57,966 $55,435 $58,059 $55,810 Net profit (loss) ($116,473) ($3,124) ($3,218) ($9,706) ($3,171) ($8,773) Gross margin (%) -21.2% -5.7% -5.9% -21.2% -5.8% -18.7% Columbia Walk-In Clinic: Monthly Incremental Cost Data Number of Additional Visits per Day 1-10 11-20 21-30 0 31-40 Variable costs: Medical supplies Administrative supplies Total variable costs per visit $3.00 per visit 0.50 per visit $3.50 per visit Semifixed costs: Salaries and wages Physician fees Total monthly semifixed costs $4,000 10.000 $14,000 $5,000 10,000 $15,000 $6,000 10,000 $16,000 $7,000 20,000 $27,000 $0 Fixed costs: Marketing assistant's salary Advertising expenses Total monthly fixed costs $3,000 4,000 $7,000 $3,000 4,000 $7,000 $3,000 4,000 $7,000 $3,000 4,000 $7,000 $3,000 4,000 $7,000 Columbia Walk-In Clinic: Historical Financial Data Monthly Averages 2009 Jan/Feb10 CY 2009 Jan 2010 Feb 2010 Combined Number of visits 14,522 1,365 1,335 1,210 1,350 1,230 Net revenue $548,747 $55,028 $54,748 $45,729 $54,888 $47,037 $13,540 18,000 3,215 538 843 $13,542 18,000 3,215 602 843 $12,952 16,286 2,705 469 700 Salaries and wages Physicians fees Malpractice insurance Travel and education General insurance Subscriptions Electricity Water Equipment rental Building lease Other operating expenses $154,250 192,000 31,440 5,365 8,112 189 11,820 1,260 1,260 155,745 103,779 0 $13,544 18,000 3,215 665 843 0 1,029 142 105 12,500 7,923 0 14 16,000 2,620 447 676 16 985 105 105 12,979 8,648 1,124 135 105 12,500 8,152 1,077 139 105 12,500 8,038 998 110 105 12,910 8,561 Total operating expenses $665,220 $58,152 $57,966 $55,435 $58,059 $55,810 Net profit (loss) ($116,473) ($3,124) ($3,218) ($9,706) ($3,171) ($8,773) Gross margin (%) -21.2% -5.7% -5.9% -21.2% -5.8% -18.7%Step by Step Solution
There are 3 Steps involved in it
Step: 1

Get Instant Access to Expert-Tailored Solutions
See step-by-step solutions with expert insights and AI powered tools for academic success
Step: 2

Step: 3
Ace Your Homework with AI
Get the answers you need in no time with our AI-driven, step-by-step assistance
Get Started
What Is Value Investing
Authors: Lawrence A. Cunningham
1st Edition
0071429557, 978-0071429559