Answered step by step
Verified Expert Solution
Question
1 Approved Answer
Question 1. Using the information above generate 12 different financial ratios that could be use to further examine the data given EXHIBIT 7 Netflix Subscriber
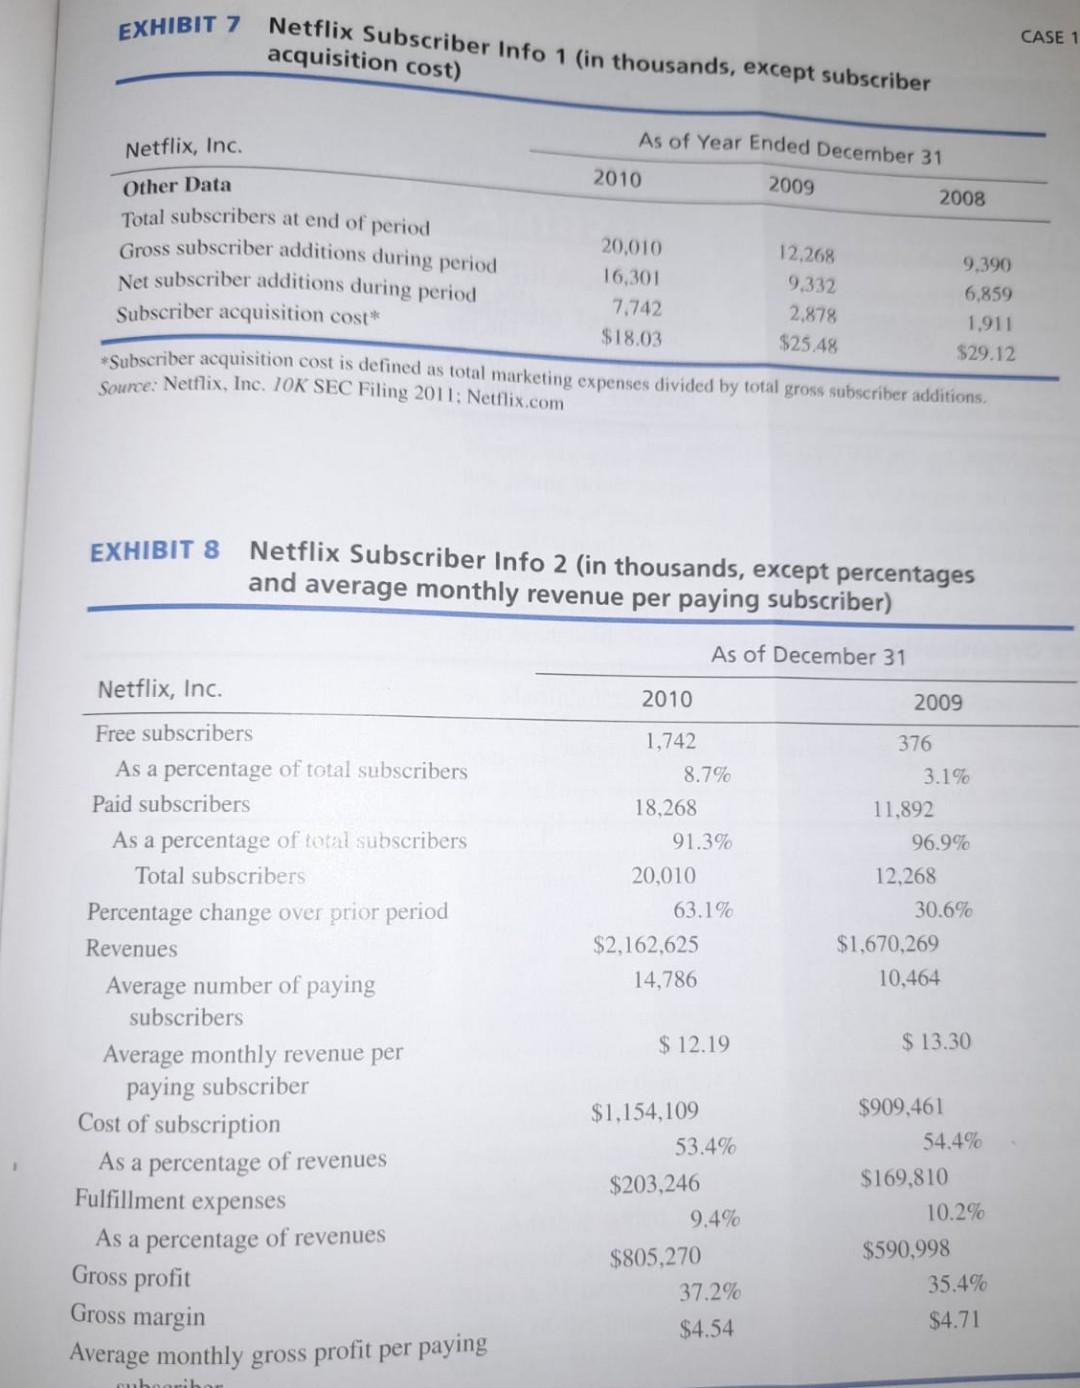
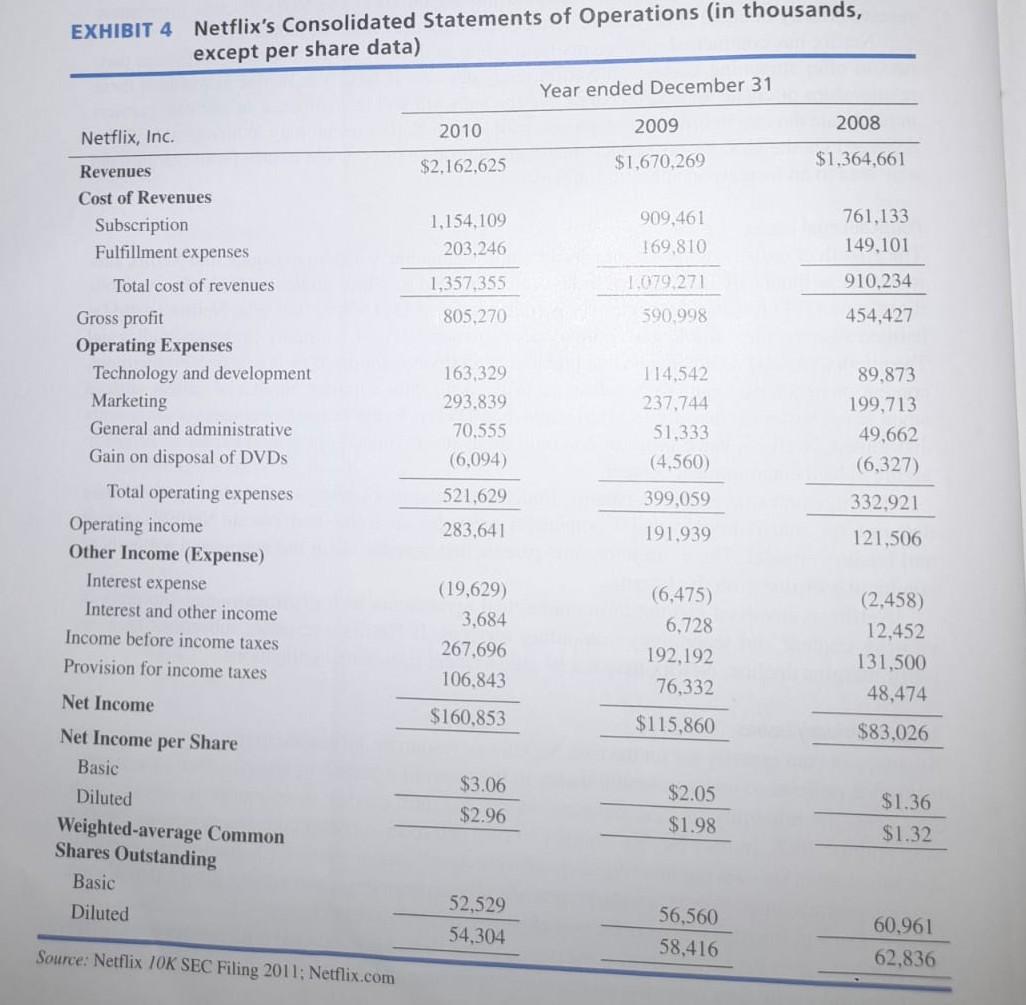
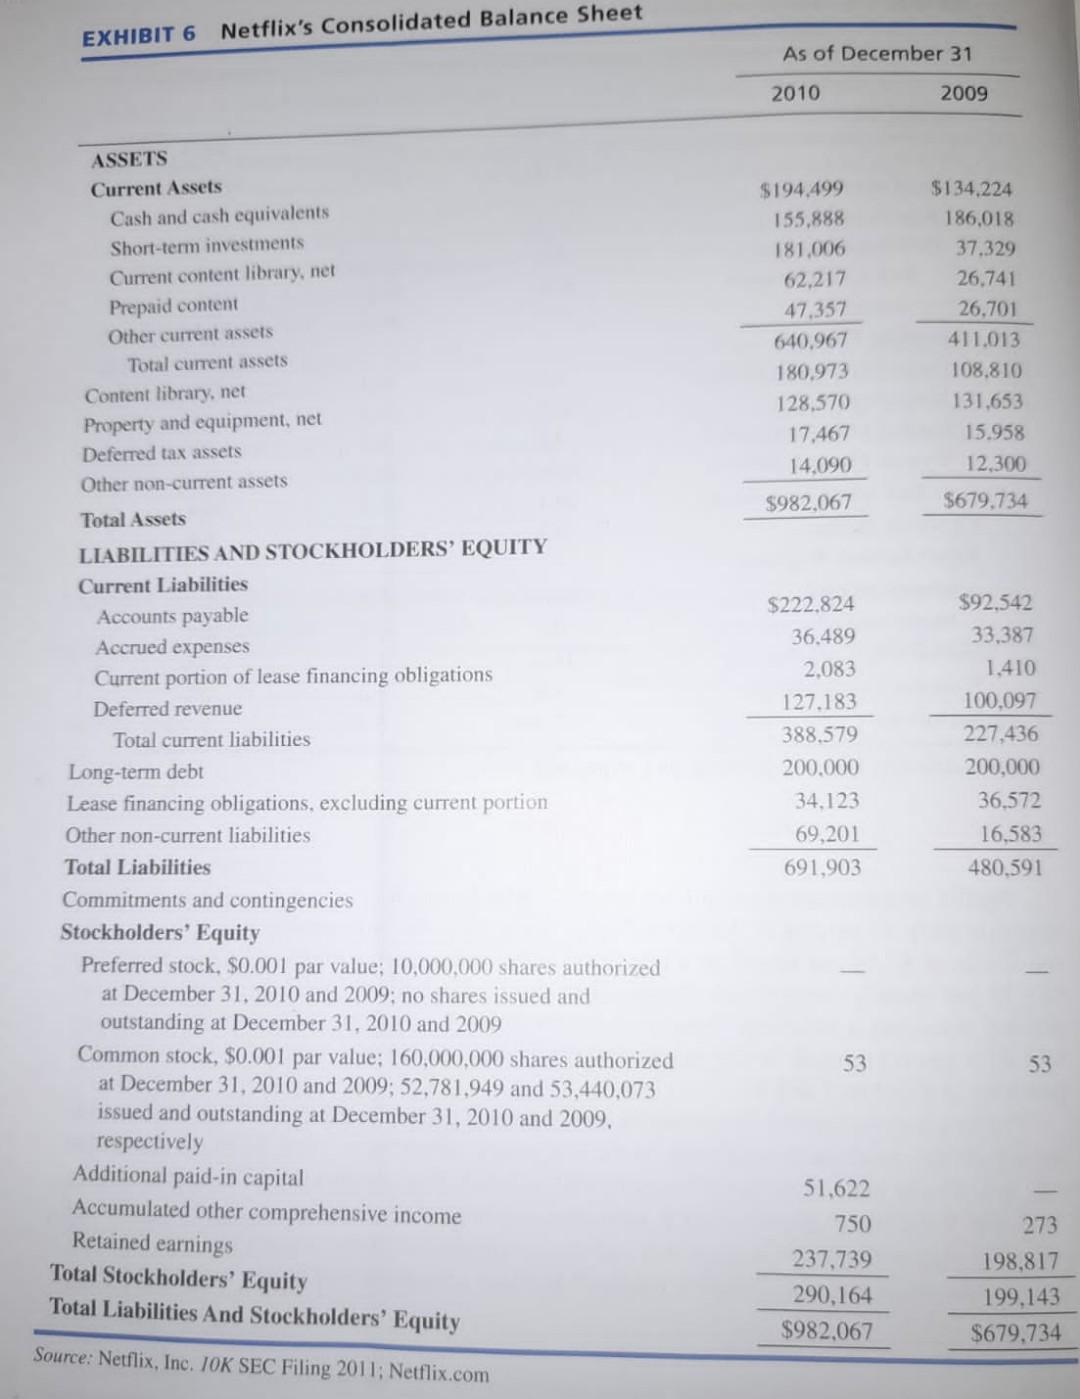
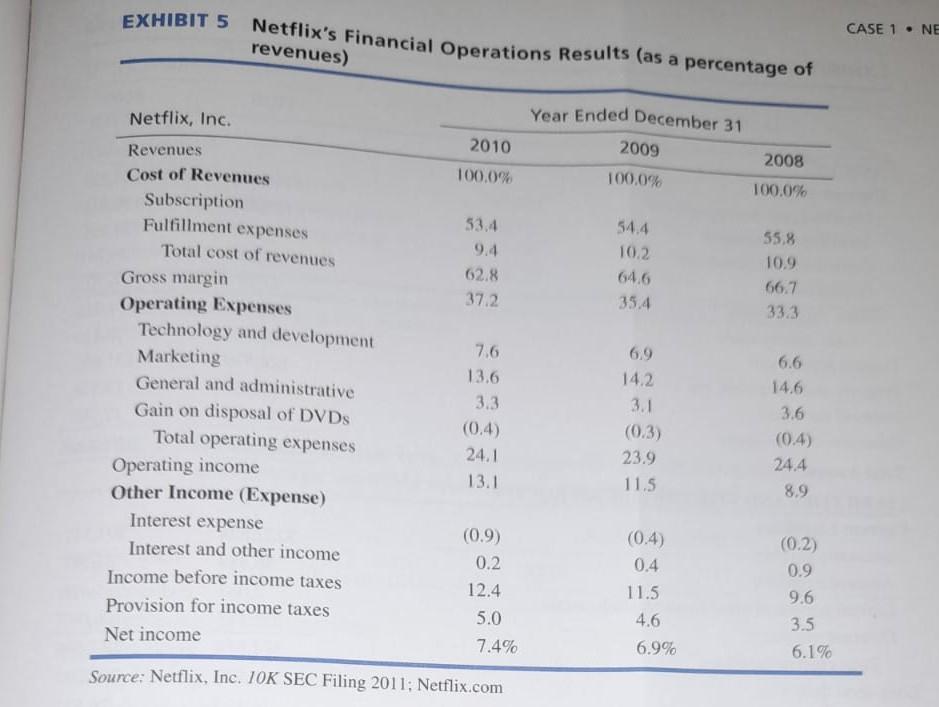
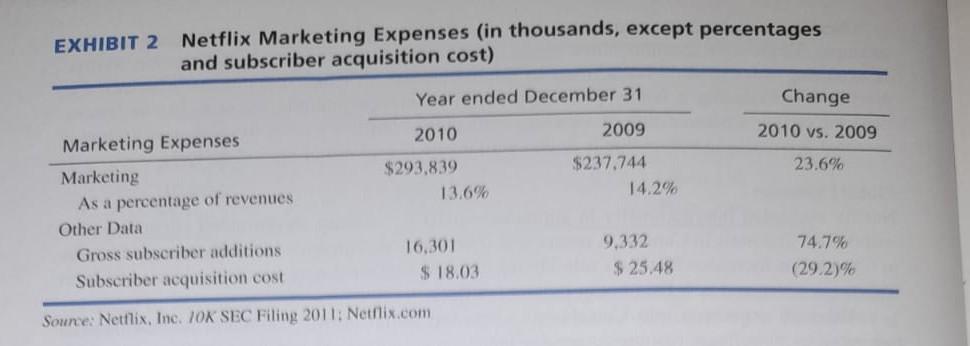
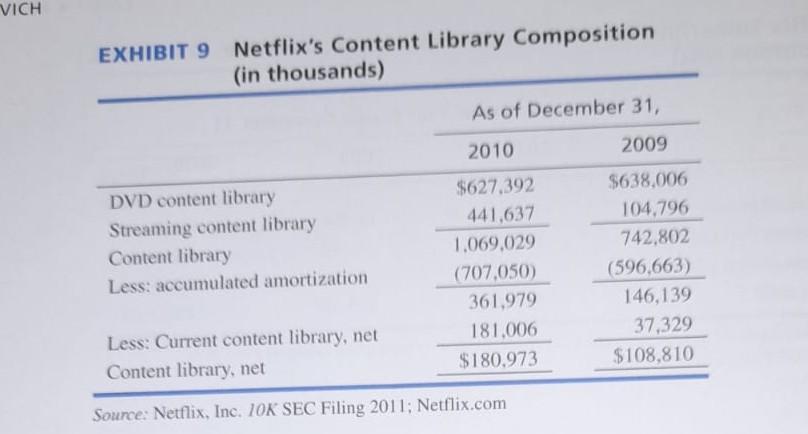
Question 1. Using the information above generate 12 different financial ratios that could be use to further examine the data given
EXHIBIT 7 Netflix Subscriber Info 1 (in thousands, except subscriber acquisition cost) Netflix, Inc. Other Data Total subscribers at end of period Gross subscriber additions during period Net subscriber additions during period Subscriber acquisition cost* EXHIBIT 8 Netflix, Inc. Free subscribers As a percentage of total subscribers Paid subscribers As a percentage of total subscribers Total subscribers Percentage change over prior period Revenues Average number of paying subscribers *Subscriber acquisition cost is defined as total marketing expenses divided by total gross subscriber additions. Source: Netflix, Inc. 10K SEC Filing 2011; Netflix.com Average monthly revenue per paying subscriber As of Year Ended December 31 2009 Cost of subscription As a percentage of revenues Fulfillment expenses 2010 Netflix Subscriber Info 2 (in thousands, except percentages and average monthly revenue per paying subscriber) As of December 31 As a percentage of revenues Gross profit Gross margin Average monthly gross profit per paying cubooribor 20,010 16,301 7,742 $18.03 2010 1,742 8.7% 18,268 91.3% 20,010 63.1% $2,162,625 14,786 $ 12.19 $1,154,109 53.4% $203,246 9.4% 12,268 9,332 2,878 $25.48 $805,270 37.2% $4.54 2008 376 2009 11,892 3.1% 12,268 9.390 6,859 1,911 $29.12 96.9% 30.6% $1,670,269 10,464 $ 13.30 $909,461 54.4% $169,810 10.2% $590,998 35.4% $4.71 CASE 1 EXHIBIT 4 Netflix's Consolidated Statements of Operations (in thousands, except per share data) Netflix, Inc. Revenues Cost of Revenues Subscription. Fulfillment expenses Total cost of revenues Gross profit Operating Expenses Technology and development Marketing General and administrative Gain on disposal of DVDs Total operating expenses Operating income Other Income (Expense) Interest expense Interest and other income Income before income taxes Provision for income taxes Net Income Net Income per Share Basic Diluted Weighted-average Common Shares Outstanding Basic Diluted Source: Netflix 10K SEC Filing 2011: Netflix.com 2010 $2,162,625 1,154,109 203,246 1,357,355 805,270 163,329 293,839 70,555 (6,094) 521,629 283,641 (19,629) 3,684 267,696 106,843 11 $160,853 $3.06 $2.96 52,529 54,304 Year ended December 31 2009 $1,670,269 909,461 169,810 1,079,271 590,998 114,542 237,744 51,333 (4,560) 399,059 191,939 (6,475) 6,728 192,192 76,332 1111 $115,860 $2.05 $1.98 56,560 58,416 2008 $1,364,661 761,133 149,101 910,234 454,427 89,873 199,713 49,662 (6,327) 332,921 121,506 (2,458) 12,452 131,500 48,474 $83,026 $1.36 $1.32 60,961 62,836 EXHIBIT 6 Netflix's Consolidated Balance Sheet ASSETS Current Assets Cash and cash equivalents Short-term investments Current content library, net Prepaid content Other current assets Total current assets Content library, net Property and equipment, net Deferred tax assets Other non-current assets Total Assets LIABILITIES AND STOCKHOLDERS' EQUITY Current Liabilities Accounts payable Accrued expenses Current portion of lease financing obligations Deferred revenue Total current liabilities Long-term debt Lease financing obligations, excluding current portion Other non-current liabilities Total Liabilities Commitments and contingencies Stockholders' Equity Preferred stock, $0.001 par value; 10,000,000 shares authorized at December 31, 2010 and 2009; no shares issued and outstanding at December 31, 2010 and 2009 Common stock, $0.001 par value; 160,000,000 shares authorized at December 31, 2010 and 2009; 52,781,949 and 53,440,073 issued and outstanding at December 31, 2010 and 2009. respectively Additional paid-in capital Accumulated other comprehensive income Retained earnings Total Stockholders' Equity Total Liabilities And Stockholders' Equity Source: Netflix, Inc. IOK SEC Filing 2011; Netflix.com As of December 31 2010 2009 $194.499 155,888 181,006 62,217 47,357 640,967 180.973 128,570 17,467 14,090 $982,067 $222,824 36.489 2,083 127.183 388,579 200.000 34,123 69,201 691,903 53 51,622 750 237,739 290,164 $982,067 $134,224 186,018 37,329 26,741 26,701 411,013 108,810 131,653 15.958 12,300 $679,734 $92,542 33,387 1,410 100,097 227,436 200,000 36,572 16,583 480,591 53 273 198,817 199,143 $679,734 EXHIBIT 5 Netflix's Financial Operations Results (as a percentage of revenues) Netflix, Inc. Revenues Cost of Revenues Subscription Fulfillment expenses Total cost of revenues Gross margin Operating Expenses Technology and development Marketing General and administrative Gain on disposal of DVDs Total operating expenses Operating income. Other Income (Expense) 2010 100.0% 53.4 9.4 62.8 37.2 7.6 13.6 3.3 (0.4) 24.1 13.1 Interest expense Interest and other income Income before income taxes Provision for income taxes Net income Source: Netflix, Inc. 10K SEC Filing 2011; Netflix.com (0.9) 0.2 12.4 5.0 7.4% Year Ended December 31 2009 100.0% 54.4 10.2 64.6 35.4 6.9 14.2 3.1 (0.3) 23.9 11.5 (0.4) 0.4 11.5 4.6 6.9% 2008 100.0% 55,8 10.9 66.7 33.3 6.6 14.6 3.6 (0.4) 24.4 8.9 (0.2) 0.9 9.6 3.5 6.1% CASE 1 NE EXHIBIT 2 Netflix Marketing Expenses (in thousands, except percentages and subscriber acquisition cost) Year ended December 31 2010 2009 $293,839 $237,744 Marketing Expenses Marketing As a percentage of revenues Other Data Gross subscriber additions Subscriber acquisition cost Source: Netflix, Inc. 10K SEC Filing 2011; Netflix.com 13.6% 16.301 $18.03 14.2% 9,332 $ 25.48 Change 2010 vs. 2009 23.6% 74.7% (29.2)% VICH EXHIBIT 9 Netflix's Content Library Composition (in thousands) DVD content library Streaming content library Content library Less: accumulated amortization As of December 31, 2010 2009 $627,392 $638,006 441.637 104,796 1,069,029 742,802 (707,050) 361,979 181,006 $180,973 Less: Current content library, net Content library, net Source: Netflix, Inc. 10K SEC Filing 2011; Netflix.com (596,663) 146,139 37,329 $108,810Step by Step Solution
There are 3 Steps involved in it
Step: 1

Get Instant Access to Expert-Tailored Solutions
See step-by-step solutions with expert insights and AI powered tools for academic success
Step: 2

Step: 3

Ace Your Homework with AI
Get the answers you need in no time with our AI-driven, step-by-step assistance
Get Started


