Question
Question 1. What would you get if you graphed these two thermal sources on a u-g/g-r color-color diagram? What do you think you would get

Question 1. What would you get if you graphed these two thermal sources on a u-g/g-r color-color diagram? What do you think you would get if you added more thermal sources (such as T = 4000 K or 8000 K) to this diagram?
Note: As a thermal source's temperature increases, its thermal radiation curve changes. As the curve changes, the object's colors also change. Because the SDSS's filters are always at the same wavelengths, though, if one color (such as u-g) decreases, the next color (g-r) will increase. When you make a color-color diagram for thermal sources of different temperatures, you will get a straight line.
Question 2. Can all the stars in your color-color diagram be considered thermal sources? Why or why not? If not, which stars are not thermal sources?
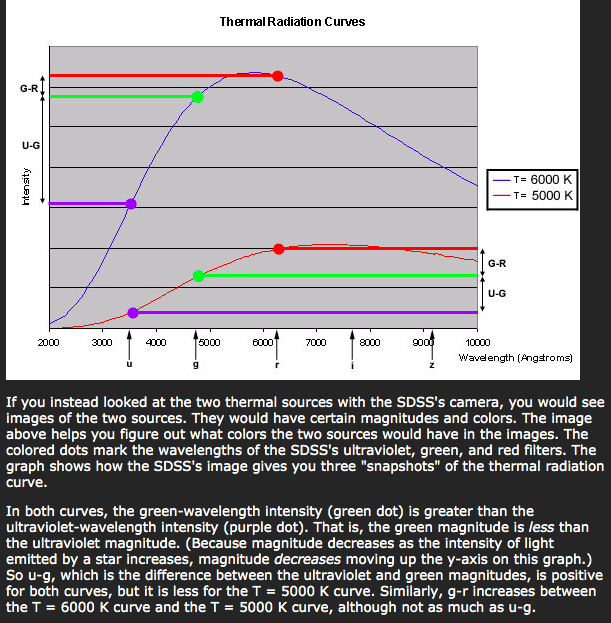
Thermal Radiation Curves G-R U-G htensity T= 6000 K T= 5000 K G-R U-G 2000 3000 4000 5000 6000 7000 8000 10000 Wavelength (Angsroms) If you instead looked at the two thermal sources with the SDSS's camera, you would see images of the two sources. They would have certain magnitudes and colors. The image above helps you figure out what colors the two sources would have in the images. The colored dots mark the wavelengths of the SDSS's ultraviolet, green, and red filters. The graph shows how the SDSS's image gives you three "snapshots" of the thermal radiation curve. In both curves, the green-wavelength intensity (green dot) is greater than the ultraviolet-wavelength intensity (purple dot). That is, the green magnitude is less than the ultraviolet magnitude. (Because magnitude decreases as the intensity of light emitted by a star increases, magnitude decreases moving up the y-axis on this graph.) So u-g, which is the difference between the ultraviolet and green magnitudes, is positive for both curves, but it is less for the T = 5000 K curve. Similarly, g-r increases between the T = 6000 K curve and the T = 5000 K curve, although not as much as u-g. Thermal Radiation Curves G-R U-G htensity T= 6000 K T= 5000 K G-R U-G 2000 3000 4000 5000 6000 7000 8000 10000 Wavelength (Angsroms) If you instead looked at the two thermal sources with the SDSS's camera, you would see images of the two sources. They would have certain magnitudes and colors. The image above helps you figure out what colors the two sources would have in the images. The colored dots mark the wavelengths of the SDSS's ultraviolet, green, and red filters. The graph shows how the SDSS's image gives you three "snapshots" of the thermal radiation curve. In both curves, the green-wavelength intensity (green dot) is greater than the ultraviolet-wavelength intensity (purple dot). That is, the green magnitude is less than the ultraviolet magnitude. (Because magnitude decreases as the intensity of light emitted by a star increases, magnitude decreases moving up the y-axis on this graph.) So u-g, which is the difference between the ultraviolet and green magnitudes, is positive for both curves, but it is less for the T = 5000 K curve. Similarly, g-r increases between the T = 6000 K curve and the T = 5000 K curve, although not as much as u-gStep by Step Solution
There are 3 Steps involved in it
Step: 1

Get Instant Access to Expert-Tailored Solutions
See step-by-step solutions with expert insights and AI powered tools for academic success
Step: 2

Step: 3

Ace Your Homework with AI
Get the answers you need in no time with our AI-driven, step-by-step assistance
Get Started


