

Question: QUESTION 1 Which method of collection of data should be used in a study where two groups are formed to determine the effectiveness of a
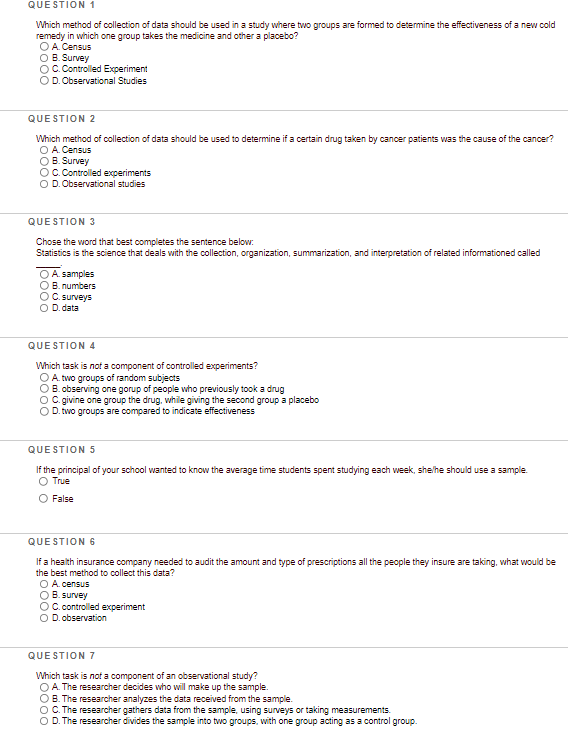
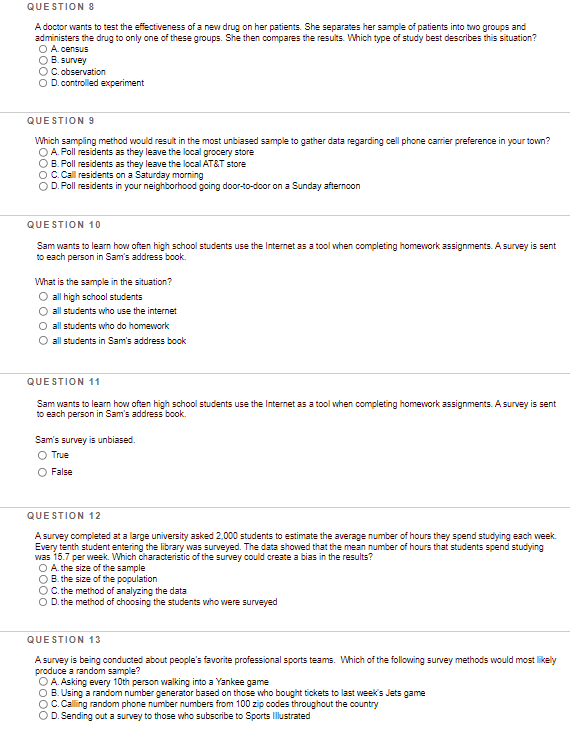
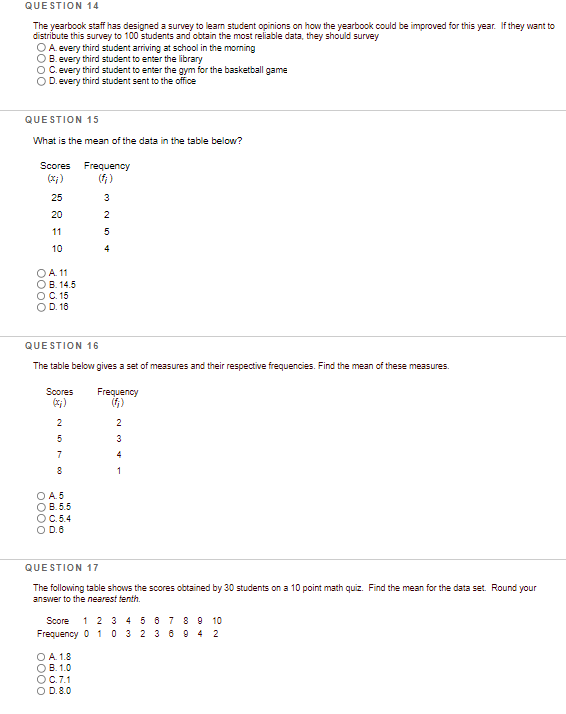
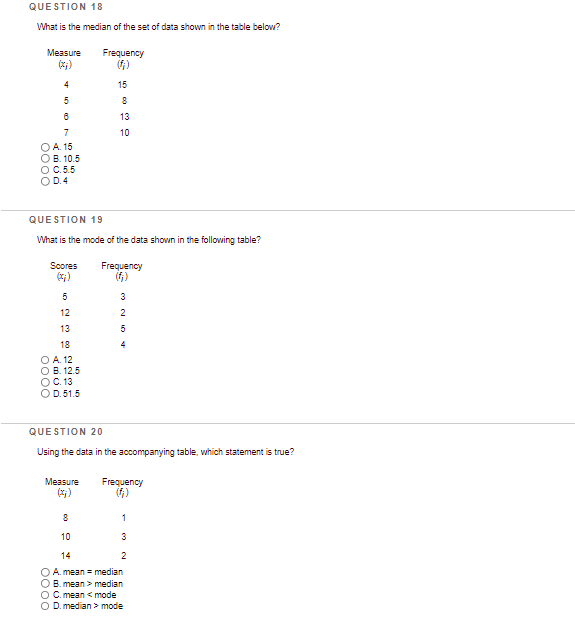
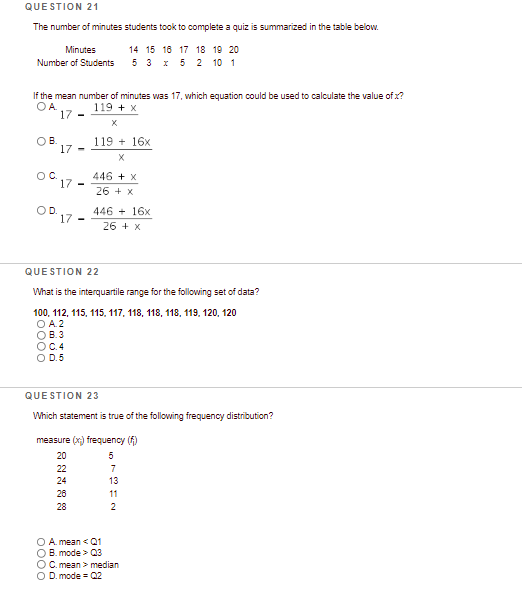
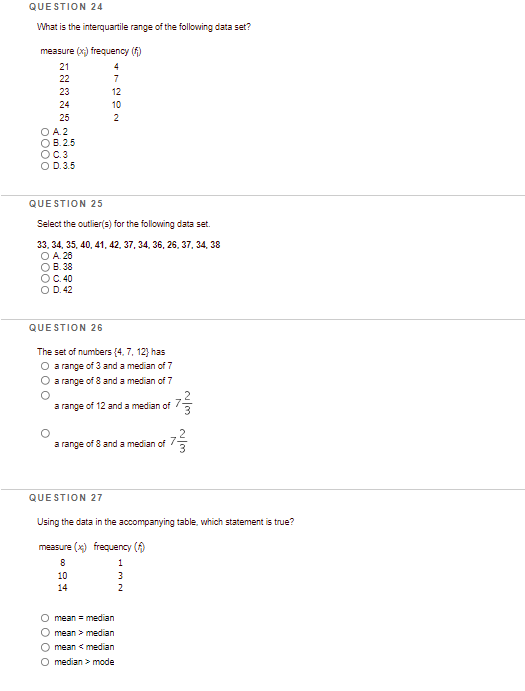
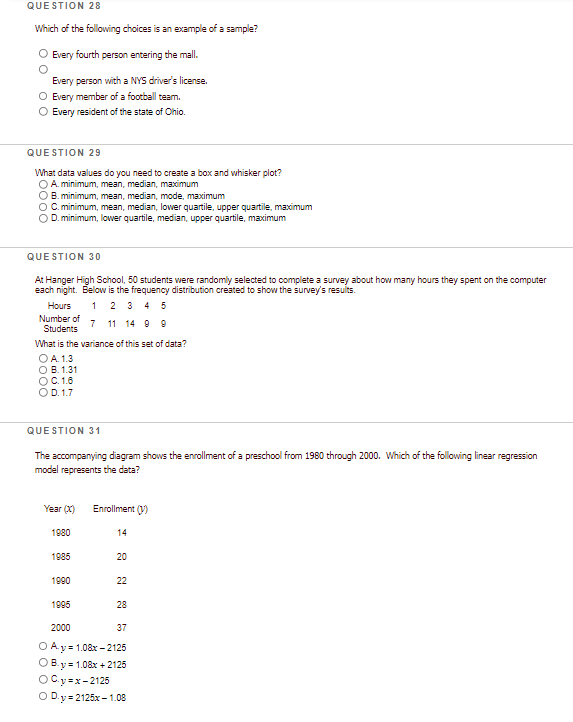
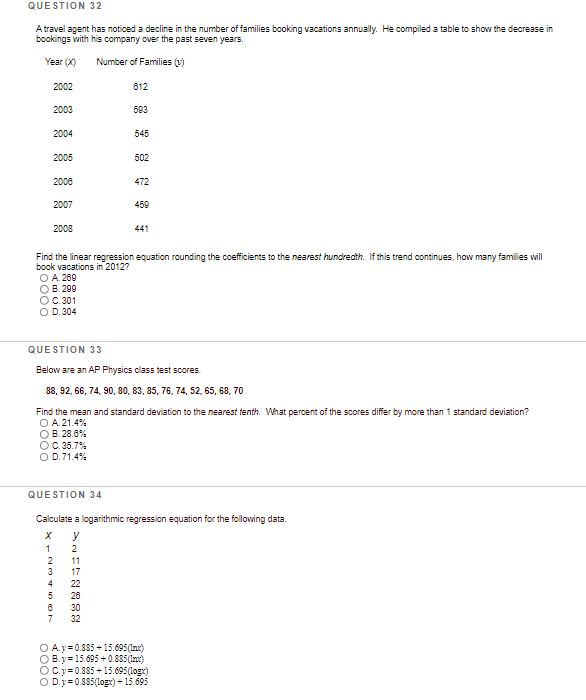
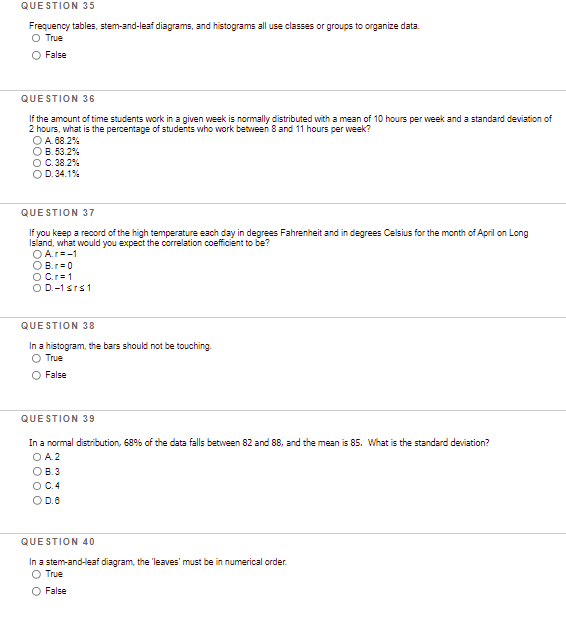
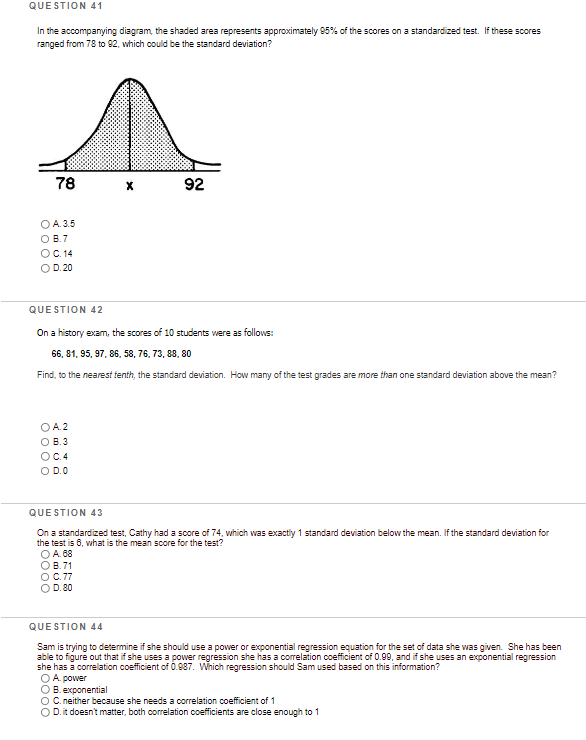
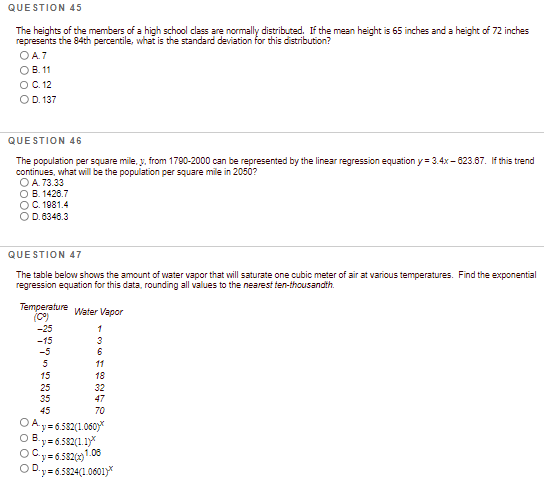
QUESTION 1 Which method of collection of data should be used in a study where two groups are formed to determine the effectiveness of a new cold remedy in which one group takes the medicine and other a placebo? O A. Census O B. Survey O C. Controlled Experiment O D. Observational Studies QUESTION 2 Which method of collection of data should be used to determine if a certain drug taken by cancer patients was the cause of the cancer? O A. Census O B. Survey O C. Controlled experiments O D. Observational studies QUESTION 3 Chose the word that best completes the sentence below. Statistics is the science that deals with the collection, organization, summarization, and interpretation of related informationed called O A. samples O B. numbers O C. surveys O D. data QUESTION 4 Which task is not a component of controlled experiments? O A. two groups of random subjects O B. observing one gorup of people who previously took a drug O C. givine one group the drug, while giving the second group a placebo O D. two groups are compared to indicate effectiveness QUESTION 5 If the principal of your school wanted to know the average time students spent studying each week, shethe should use a sample O True O False QUESTION 6 If a health insurance company needed to audit the amount and type of prescriptions all the people they insure are taking, what would be the best method to collect this data? O A. census O B. survey O C. controlled experiment O D. observation QUESTION 7 Which task is not a component of an observational study? O A. The researcher decides who will make up the sample. O B. The researcher analyzes the data received from the sample. O C. The researcher gathers data from the sample, using surveys or taking measurements. O D. The researcher divides the sample into two groups, with one group acting as a control group.QUESTION 8 A doctor wants to test the effectiveness of a new drug on her patients. She separates her sample of patients into two groups and administers the drug to only one of these groups. She then compares the results. Which type of study best describes this situation? O A. census O B. survey O C. observation O D. controlled experiment QUESTION 9 Which sampling method would result in the most unbiased sample to gather data regarding cell phone carrier preference in your town? O A. Poll residents as they leave the local grocery store O B. Poll residents as they leave the local AT&T store O C. Call residents on a Saturday morning O D. Poll residents in your neighborhood going door-to-door on a Sunday afternoon QUESTION 10 Sam wants to learn how often high school students use the Internet as a tool when completing homework assignments. A survey is sent to each person in Sam's address book. What is the sample in the situation? O all high school students O all students who use the internet O all students who do homework O all students in Sam's address book QUESTION 11 Sam wants to learn how often high school students use the Internet as a tool when completing homework assignments. A survey is sent to each person in Sam's address book. Sam's survey is unbiased. O True O False QUESTION 12 A survey completed at a large university asked 2,000 students to estimate the average number of hours they spend studying each week. Every tenth student entering the library was surveyed. The data showed that the mean number of hours that students spend studying was 15.7 per week. Which characteristic of the survey could create a bias in the results? O A. the size of the sample O B. the size of the population O C. the method of analyzing the data O D. the method of choosing the students who were surveyed QUESTION 13 A survey is being conducted about people's favorite professional sports teams. Which of the following survey methods would most likely produce a random sample? O A. Asking every 10th person walking into a Yankee game O B. Using a random number generator based on those who bought tickets to last week's Jets game O C. Calling random phone number numbers from 100 zip codes throughout the country O D. Sending out a survey to those who subscribe to Sports IllustratedQUESTION 14 The yearbook staff has designed a survey to learn student opinions on how the yearbook could be improved for this year. If they want to distribute this survey to 100 students and obtain the most reliable data, they should survey A. every third student arriving at school in the morning O B. every third student to enter the library O C. every third student to enter the gym for the basketball game D. every third student sent to the office QUESTION 15 What is the mean of the data in the table below? Scores Frequency (f; ) 25 3 20 11 10 OA. 11 O B. 14.5 C. 15 O D. 16 QUESTION 16 The table below gives a set of measures and their respective frequencies. Find the mean of these measures. Scores Frequency OAS 3.5.5 C. QUESTION 17 The following table shows the scores obtained by 30 students on a 10 point math quiz. Find the mean for the data set. Round your answer to the nearest tenth. Score 123 4 5 6 7 89 10 Frequency 0 1 0 3 2 3 6 9 4 2 O A. 1.8 O B. 1.0 O C.7.1 O D.8.0QUESTION 18 What is the median of the set of data shown in the table below? Measure Frequency 4 15 13 7 10 O A. 15 O B. 10.5 C.5.5 OD.4 QUESTION 19 What is the mode of the data shown in the following table? Scores Frequency 5 12 13 18 O A. 12 B. 12.5 O C. 13 O D.51.5 QUESTION 20 Using the data in the accompanying table, which statement is true? Measure Frequency (fi) 10 3 14 O A. mean = median O B. mean > median O C. mean modeQUESTION 21 The number of minutes students took to complete a quiz is summarized in the table below. Minutes 14 15 18 17 18 19 20 Number of Students 5 3 x 5 2 10 1 If the mean number of minutes was 17, which equation could be used to calculate the value of x? OA 17 - 119 + X 17 - 119 + 16x X O C. 17 - 446 + X 26 + X OD. 17 - 446 + 16x 26 + x QUESTION 22 What is the interquartile range for the following set of data? 100, 112, 115, 115, 117, 118, 118, 118, 119, 120, 120 O A.2 OB.3 O0.4 O D.5 QUESTION 23 Which statement is true of the following frequency distribution? measure () frequency (f) 20 22 7 24 13 26 11 78 O A. mean 03 O C. mean > median O D. mode = Q2QUESTION 24 What is the interquartile range of the following data set? measure () frequency (f) 21 22 23 12 24 10 25 O A2 OB.25 OC.3 O D.3.5 QUESTION 25 Select the outlier(s) for the following data set. 33. 34, 35, 40, 41, 42, 37, 34, 36, 26, 37, 34, 38 O A. 26 O B. 38 O C. 40 O D. 42 QUESTION 26 The set of numbers {4 7, 12} has O a range of 3 and a median of 7 O a range of & and a median of 7 O a range of 12 and a median of O a range of 8 and a median of 7- QUESTION 27 Using the data in the accompanying table, which statement is true? measure (x) frequency (f) 8 10 NWP 14 O mean = median O mean > median O mean modeQUESTION 28 Which of the following choices is an example of a sample? O Every fourth person entering the mall. Every person with a NYS driver's license. O Every member of a football team. O Every resident of the state of Ohio. QUESTION 29 What data values do you need to create a box and whisker plot? O A. minimum, mean, median, maximum O B. minimum, mean, median, mode, maximum O C. minimum, mean, median, lower quartile, upper quartile, maximum O D. minimum, lower quartile, median, upper quartile, maximum QUESTION 30 At Hanger High School, 50 students were randomly selected to complete a survey about how many hours they spent on the computer each night. Below is the frequency distribution created to show the survey's results. Hours 1 2 3 4 5 Number of Students 7 11 14 9 9 What is the variance of this set of data? O A. 1.3 O B. 1.31 O C. 1.6 OD. 1.7 QUESTION 31 The accompanying diagram shows the enrollment of a preschool from 1980 through 2000. Which of the following linear regression model represents the date? Year ()() Enrollment ()) 1080 14 1085 20 1890 22 1095 28 2000 37 O A. y = 1.08x - 2125 O B. y= 1.08x + 2125 OCy=x-2125 O D. y = 2125x - 1.08QUESTION 32 A travel agent has noticed a decline in the number of families booking vacations annually. He compiled a table to show the decrease in bookings with his company over the past seven years. Year ()) Number of Families (v) 2002 612 2003 503 2004 545 2005 502 2008 472 2007 450 2008 441 Find the linear regression equation rounding the coefficients to the nearest hundredth. If this trend continues, how many families will book vacations in 2012? O A. 269 O B. 299 OC. 301 O D. 304 QUESTION 33 Below are an AP Physics class test scores. 88, 92, 66, 74, 90, 80, 83, 85, 76, 74, 52, 65, 68, 70 Find the mean and standard deviation to the nearest tenth. What percent of the scores differ by more than 1 standard deviation? O A. 21.4 O B. 28.8%% O C. 35.7% O D. 71.4 QUESTION 34 Calculate a logarithmic regression equation for the following data. NUB NEENS 7 =0.835 + 15.695(Imxx) 0.835 (Imxx) P. P. P. P. 0.835 + 15.695(logx) D. y= 0.835(logx) + 15.695QUESTION 35 Frequency tables, stem-and-leaf diagrams, and histograms all use classes or groups to organize data. O True False QUESTION 36 If the amount of time students work in a given week is normally distributed with a mean of 10 hours per week and a standard deviation of 2 hours, what is the percentage of students who work between 8 and 11 hours per week? O A. 68.2% O B. 53.2% O C. 38.2% O D. 34.1% QUESTION 37 If you keep a record of the high temperature each day in degrees Fahrenheit and in degrees Celsius for the month of April on Long Island, what would you expect the correlation coefficient to be? OAr=-1 OB.r= 0 O C.r= 1 OD.-1Ers1 QUESTION 38 In a histogram, the bars should not be touching. O True O False QUESTION 39 In a normal distribution, 68% of the date falls between 82 and 86, and the mean is 85. What is the standard deviation? OA2 OB.3 O C.4 OD.8 QUESTION 40 In a stem-and-leaf diagram, the 'leaves' must be in numerical order. True O FalseQUESTION 41 In the accompanying diagram, the shaded area represents approximately 95%% of the scores on a standardized test. If these scores ranged from 78 to 92, which could be the standard deviation? 78 X 92 OA. 3.5 O B.7 O C. 14 O D. 20 QUESTION 42 On a history exam, the scores of 10 students were as follows: 66, 81, 95, 97, 86, 58, 76, 73, 88, 80 Find, to the nearest tenth, the standard deviation. How many of the test grades are more than one standard deviation above the mean? OA.2 OB.3 OC.4 O DO QUESTION 43 On a standardized test, Cathy had a score of 74, which was exactly 1 standard deviation below the mean. If the standard deviation for the test is 6, what is the mean score for the test? O A. 68 O B. 71 O 0.77 O D. 80 QUESTION 44 Sam is trying to determine if she should use a power or exponential regression equation for the set of data she was given. She has been able to figure out that if she uses a power regression she has a correlation coefficient of 0.09, and if she uses an exponential regression she has a correlation coefficient of 0.087. Which regression should Sam used based on this information? A. power O B. exponential O C. neither because she needs a correlation coefficient of 1 O D. it doesn't matter, both correlation coefficients are close enough to 1QUESTION 45 The heights of the members of a high school class are normally distributed. If the mean height is 65 inches and a height of 72 inches represents the 84th percentile, what is the standard deviation for this distribution? OAT OB. 11 O C. 12 O D. 137 QUESTION 46 The population per square mile, y, from 1790-2000 can be represented by the linear regression equation y = 3.4x - 823.87. If this trend continues, what will be the population per square mile in 2050? O A. 73.33 O B. 1426.7 O C. 1981.4 O D. 6346.3 QUESTION 47 The table below shows the amount of water vapor that will saturate one cubic meter of air at various temperatures. Find the exponential regression equation for this data, rounding all values to the nearest fen-thousandth. Temperature Water Vapor 5 11 15 18 25 32 35 47 45 70 Ay= 6.502(1.060) By= 6.502(1.1)* O Cy=6.5020x) 1-08 O Dy= 6.5624(1 0601}*
Step by Step Solution
There are 3 Steps involved in it

Get step-by-step solutions from verified subject matter experts