Answered step by step
Verified Expert Solution
Link Copied!

Question

1 Approved Answer

Question 1 Which one of the following methods can NOT be used for a numeric response variable? Group of answer choices Random Forest Regression Tree

Question 1

Which one of the following methods can NOT be used for a numeric response variable?

Group of answer choices

Random Forest

Regression Tree

K nearest Neighbor

Classification Tree

Question 2

Given data, we get the following result for a logistic regressionln?(oddsratio)=2x?1. what is the estimate of p (probability of success) at pointx=0.10415

Group of answer choices

-0.7917

0.31

3.20

0.28

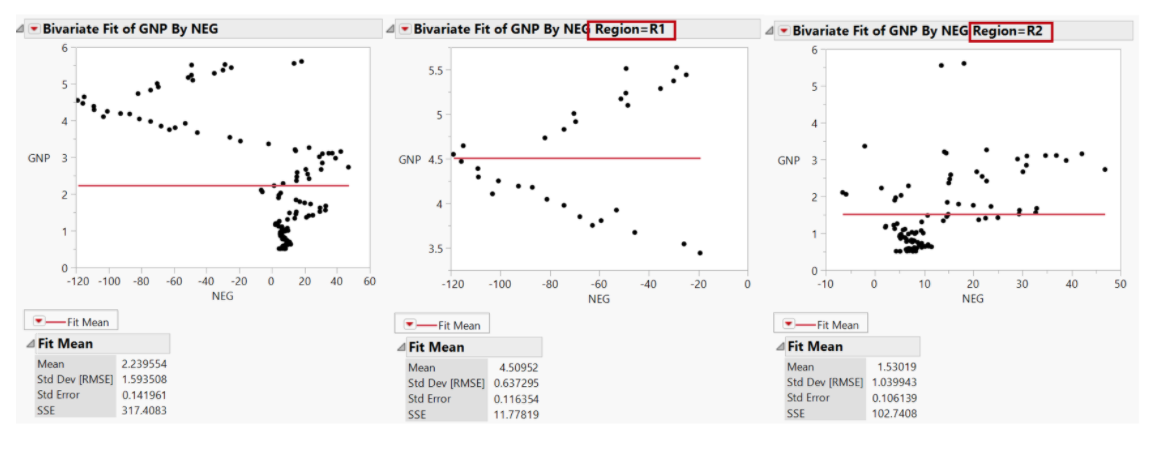
Consider the following problem. We want to create an regression tree (with one split) on the NEG variable to predict the average GDP in each region (R1 and R2). The no split model is represented in the left graph.

Assume by one split at NEG

Answer the following three questions.

image text in transcribedimage text in transcribedimage text in transcribedimage text in transcribed
4Bivariate Fit of GNP By NEG 4 Bivariate Fit of GNP By NEG Region=R1 4 Bivariate Fit of GNP By NEG Region=R2 6 5.5 5 5 5 GNP 3 GNP 4.5 GNP 3- . . 2 2 1 3.5- 0 0 -120 -100 -80 -60 -40 -20 0 20 40 60 -120 -100 -80 60 40 -20 0 -10 0 10 20 30 40 50 NEG NEG NEG -Fit Mean -Fit Mean -Fit Mean 4 Fit Mean Fit Mean Fit Mean Mean 2.239554 Mean 4.50952 Mean 1.53019 Std Dev [RMSE] 1.593508 Std Dev [RMSE] 0.637295 Std Dev [RMSE] 1.039943 Std Error 0.141961 Std Error 0.116354 Std Error 0.106139 SSE 317.4083 SSE 11.77819 SSE 102.7408\fAll Rows Count 442 LogWorth Difference Mean 152.13348 50.049357 83.1655 Std Dev 77.093005 LTG =4.6052 Count 218 LogWorth Difference Count 224 LogWorth Difference Mean 109.98624 14.507959 63.4347 Mean 193.15179 13.405011 63.1986 Std Dev 57.059229 Std Dev 71.823677 BMI =27.0 BMI =27.8 Count 171 LogWorth Difference Count 47 Count 116 LogWorth Difference Count 108 LogWorth Difference Mean 96.309942 2.6114474 25.4356 Mean 159.74468 Mean 162.68103 1.8805581 39.1744 Mean 225.87963 4.9791443 60.2995 Std Dev 46.438991 Std Dev 64.526526 Std Dev 64.276387 Std Dev 64.985795 D Candidates HDL> =56 HDL =24.4 BMI =32.8 Count 84 Count 87 Count 42 Count 74 Count 77 Count 31 Mean 83.369048 Mean 108.8046 Mean 137.69048 Mean 176.86486 Mean 208.57143 Mean 268.87097 Std Dev 33.006673 Std Dev 53.759334 Std Dev 54.217038 Std Dev 65.530569 Std Dev 63.390068 Std Dev 46.948015 D Candidates D Candidates D Candidates D Candidates DCandidates D Candidates\f

Step by Step Solution

There are 3 Steps involved in it

Step: 1

blur-text-image

Get Instant Access to Expert-Tailored Solutions

See step-by-step solutions with expert insights and AI powered tools for academic success

Step: 2

blur-text-image

Step: 3

blur-text-image

Ace Your Homework with AI

Get the answers you need in no time with our AI-driven, step-by-step assistance

Get Started

Recommended Textbook for

Statistical Inference

Authors: George Casella, Roger L. Berger

2nd edition

0534243126, 978-0534243128

More Books

Students also viewed these Mathematics questions