

Answered step by step
Verified Expert Solution
Question
1 Approved Answer
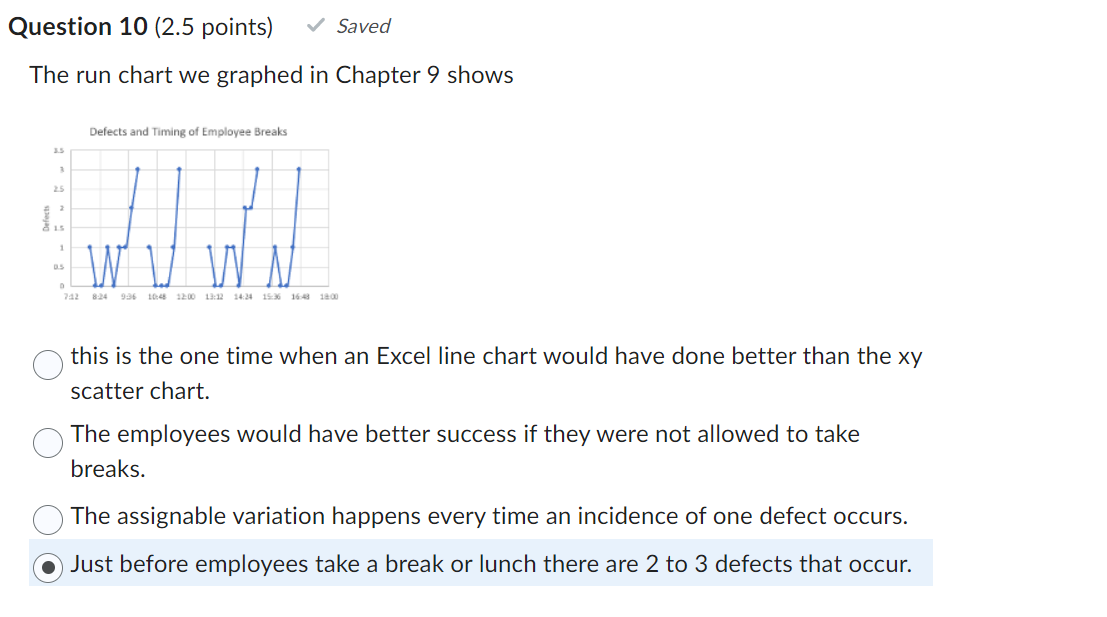
Question 10 (2.5 points) Saved The run chart we graphed in Chapter 9 shows Defects and Timing of Employee Breaks 25 Defect 7:42 8-24 9:36
Step by Step Solution
There are 3 Steps involved in it
Step: 1

Get Instant Access to Expert-Tailored Solutions
See step-by-step solutions with expert insights and AI powered tools for academic success
Step: 2

Step: 3
Ace Your Homework with AI
Get the answers you need in no time with our AI-driven, step-by-step assistance
Get Started
Operations Management Creating Value Along the Supply Chain
Authors: Roberta S. Russell, Bernard W. Taylor
7th Edition
9781118139523, 0470525908, 1118139526, 978-0470525906