Answered step by step
Verified Expert Solution
Question
1 Approved Answer
Question # 10 Accounting Answer Part a ? Answer the Part correctly for a Like! Current Attempt in Progress Brooks Clinic is considering investing in
Question # 10
Accounting
Answer Part a ? 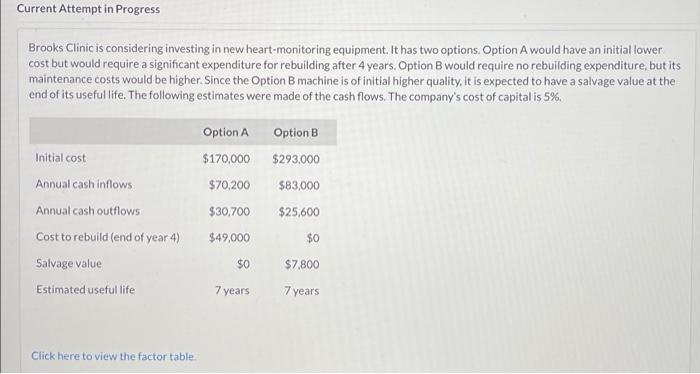
Answer the Part correctly for a Like!
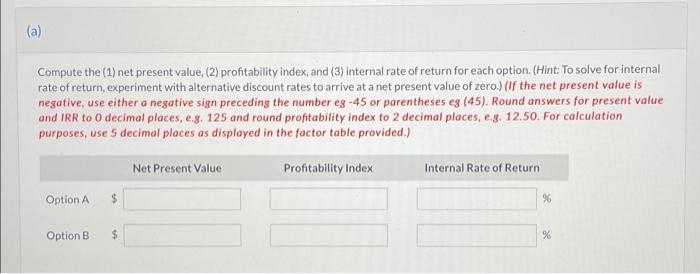
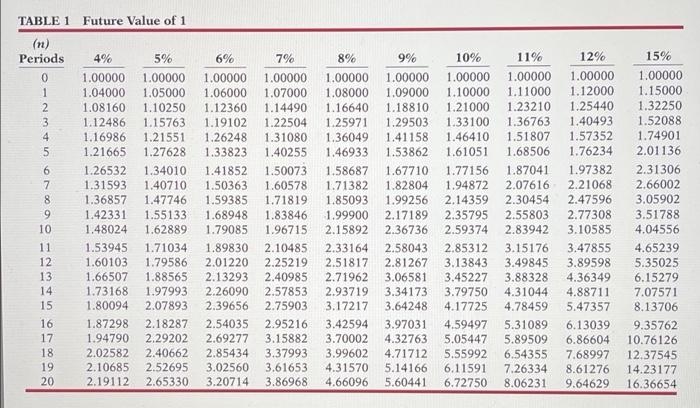
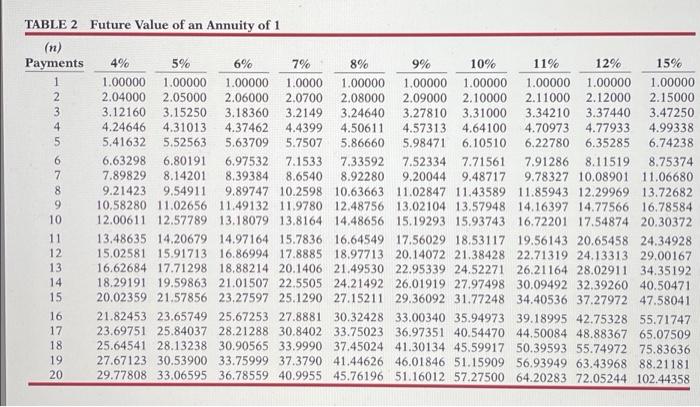
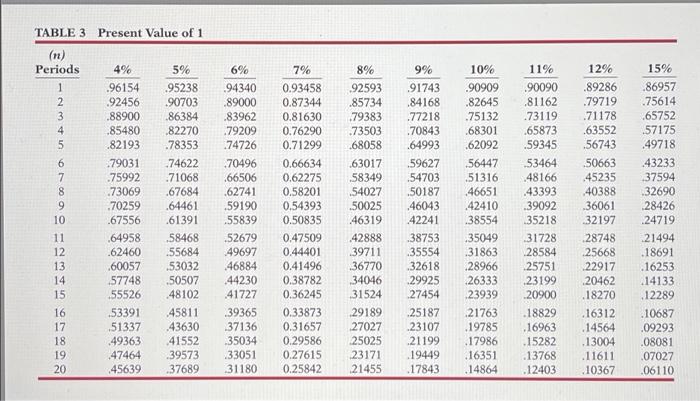
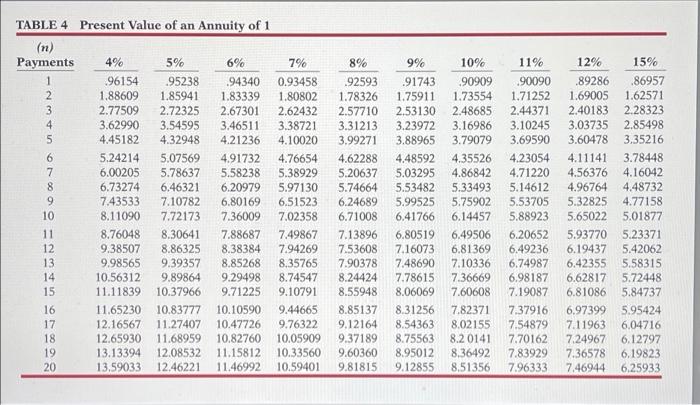
Current Attempt in Progress Brooks Clinic is considering investing in new heart-monitoring equipment. It has two options. Option A would have an initial lower cost but would require a significant expenditure for rebuilding after 4 years. Option B would require no rebuilding expenditure, but its maintenance costs would be higher. Since the Option B machine is of initial higher quality, it is expected to have a salvage value at the end of its useful life. The following estimates were made of the cash flows. The company's cost of capital is 5%. Option B $293,000 Initial cost Annual cash inflows Option A $170,000 $70,200 $30,700 $49,000 $83,000 Annual cash outflows $25,600 Cost to rebuild (end of year 4) $0 Salvage value $0 $7,800 Estimated useful life 7 years 7 years Click here to view the factor table (a) Compute the (1) net present value (2) profitability index, and (3) Internal rate of return for each option. (Hint: To solve for internal rate of return, experiment with alternative discount rates to arrive at a net present value of zero.) (if the net present value is negative, use either a negative sign preceding the number eg - 45 or parentheses eg (45). Round answers for present value and IRR to 0 decimal places, eg, 125 and round profitability index to 2 decimal places, e.g. 12.50. For calculation purposes, use 5 decimal places as displayed in the factor table provided.) Net Present Value Profitability Index Internal Rate of Return Option A $ 96 Option B $ % TABLE 1 Future Value of 1 (n) Periods 5% 6% 7% 8% 10% 0 1 2 3 4 5 ON 6 7 8 9 10 11 4% 1.00000 1.04000 1.08160 1.12486 1.16986 1.21665 1.26532 1.31593 1.36857 1.42331 1.48024 1.53945 1.60103 1.66507 1.73168 1.80094 1.87298 1.94790 2.02582 2.10685 2.19112 1.00000 1.05000 1.10250 1.15763 1.21551 1.27628 1.34010 1.40710 1.47746 1.55133 1.62889 1.71034 1.79586 1.88565 1.97993 2.07893 2.18287 2.29202 2.40662 2.52695 2.65330 1.00000 1.06000 1.12360 1.19102 1.26248 1.33823 1.41852 1.50363 1.59385 1.68948 1.79085 1.89830 2.01220 2.13293 2.26090 2.39656 2.54035 2.69277 2.85434 3.02560 3.20714 1.00000 1.07000 1.14490 1.22504 1.31080 1.40255 1.50073 1.60578 1.71819 1.83846 1.96715 2.10485 2.25219 2.40985 2.57853 2.75903 2.95216 3.15882 3.37993 3.61653 3.86968 1.00000 1.08000 1.16640 1.25971 1.36049 1.46933 1.58687 1.71382 1.85093 1.99900 2.15892 2.33164 2.51817 2.71962 2.93719 3.17217 3.42594 3.70002 3.99602 4.31570 4.66096 9% 1.00000 1.09000 1.18810 1.29503 1.41158 1.53862 1.67710 1.82804 1.99256 2.17189 2.36736 2.58043 2.81267 3.06581 3.34173 3.64248 3.97031 4.32763 4.71712 5.14166 5.60441 1.00000 1.10000 1.21000 1.33100 1.46410 1.61051 1.77156 1.94872 2.14359 2.35795 2.59374 2.85312 3.13843 3.45227 3.79750 4.17725 4.59497 5.05447 5.55992 6.11591 6.72750 11% 1.00000 1.11000 1.23210 1.36763 1.51807 1.68506 1.87041 2.07616 2.30454 2.55803 2.83942 3.15176 3.49845 3.88328 4.31044 4.78459 5.31089 5.89509 6.54355 7.26334 8.06231 12% 1.00000 1.12000 1.25440 1.40493 1.57352 1.76234 1.97382 2.21068 2.47596 2.77308 3.10585 3.47855 3.89598 4.36349 4.88711 5.47357 6.13039 6.86604 7.68997 8.61276 9.64629 15% 1.00000 1.15000 1.32250 1.52088 1.74901 2.01136 2.31306 2.66002 3.05902 3.51788 4.04556 4.65239 5.35025 6.15279 7.07571 8.13706 9.35762 10.76126 12.37545 14.23177 16.36654 12 UAWN O 13 14 15 16 17 18 19 20 TABLE 2 Future Value of an Annuity of 1 (n) Payments 1 2 3 4 5 6 7 8 9 10 11 12 13 14 15 16 17 18 19 20 4% 5% 6% 7% 8% 9% 10% 11% 12% 15% 1.00000 1.00000 1.00000 1.0000 1.00000 1.00000 1.00000 1.00000 1.00000 1.00000 2.04000 2.05000 2.06000 2.0700 2.08000 2.09000 2.10000 2.11000 2.12000 2.15000 3.12160 3.15250 3.18360 3.2149 3.24640 3.27810 3.31000 3.34210 3.37440 3.47250 4.24646 4.31013 4.37462 4.4399 4.50611 4.57313 4.64100 4.70973 4.77933 4.99338 5.41632 5.52563 5.63709 5.7507 5.86660 5.98471 6.10510 6.22780 6.35285 6.74238 6.63298 6.80191 6.97532 7.1533 7.33592 7.52334 7.71561 7.91286 8.11519 8.75374 7.89829 8.14201 8.39384 8.6540 8.92280 9.20044 9.48717 9.78327 10.08901 11.06680 9.21423 9.54911 9.89747 10.2598 10.63663 11.02847 11.43589 11.85943 12.29969 13.72682 10,58280 11.02656 11.49132 11.9780 12.48756 13.02104 13.57948 14.16397 14.77566 16.78584 12.00611 12.57789 13.18079 13.8164 14.48656 15.19293 15.9374316.72201 17.54874 20.30372 13.48635 14,20679 14.97164 15.7836 16.64549 17.56029 18.53117 19.56143 20.65458 24.34928 15.02581 15.91713 16.86994 17.8885 18.97713 20.14072 21.38428 22.71319 24.13313 29.00167 16.62684 17.71298 18.88214 20.1406 21.49530 22.95339 24.52271 26.21164 28.02911 34.35192 18.29191 19.59863 21.01507 22.5505 24.21492 26.01919 27.97498 30.09492 32.39260 40.50471 20.02359 21.57856 23.27597 25.1290 27.15211 29.36092 31.77248 34.40536 37.27972 47.58041 21.82453 23.65749 25.67253 27.8881 30.32428 33.00340 35.94973 39.18995 42.75328 55.71747 23.69751 25.84037 28.21288 30.8402 33.75023 36.97351 40.54470 44.50084 48.88367 65.07509 25.64541 28.13238 30.90565 33.9990 37.45024 41.30134 45.59917 50.39593 55.7497275.83636 27.67123 30.53900 33.75999 37.3790 41.44626 46.01846 51.15909 56.93949 63.43968 88.21181 29.77808 33.06595 36.78559 40.9955 45.76196 51.16012 57.27500 64.20283 72.05244 102.44358 TABLE 3 Present Value of 1 (n) Periods 1 2 3 4 5 mu 10 11 12 13 14 15 5636W 500 va 4% .96154 .92456 .88900 .85480 .82193 -79031 .75992 .73069 .70259 .67556 ,64958 .62460 .60057 57748 55526 .53391 51337 .49363 47464 45639 5% 95238 .90703 .86384 .82270 .78353 .74622 71068 .67684 .64461 .61391 .58468 .55684 .53032 .50507 48102 .45811 43630 41552 39573 37689 6% 94340 .89000 .83962 .79209 74726 .70496 66506 .62741 .59190 .55839 .52679 49697 .46884 44230 41727 39365 37136 35034 33051 31180 7% 0.93458 0.87344 0.81630 0.76290 0.71299 0.66634 0.62275 0.58201 0.54393 0.50835 0.47509 0.44401 0.41496 0.38782 0.36245 0.33873 0.31657 0.29586 0.27615 0.25842 8% 92593 .85734 .79383 .73503 .68058 .63017 .58349 .54027 .50025 46319 .42888 .39711 -36770 34046 31524 29189 27027 25025 23171 21455 9% 91743 .84168 .77218 .70843 .64993 59627 .54703 .50187 .46043 42241 38753 .35554 .32618 .29925 27454 .25187 .23107 .21199 19449 .17843 10% .90909 .82645 .75132 .68301 .62092 .56447 .51316 46651 .42410 38554 35049 31863 .28966 26333 .23939 21763 .19785 .17986 .16351 .14864 11% 90090 .81162 .73119 .65873 .59345 53464 48166 .43393 .39092 135218 31728 28584 25751 .23199 .20900 .18829 .16963 .15282 .13768 .12403 12% .89286 .79719 .71178 .63552 456743 .50663 45235 .40388 36061 32197 .28748 25668 22917 120462 .18270 .16312 .14564 .13004 .11611 10367 15% .86957 -75614 .65752 .57175 .49718 .43233 37594 .32690 28426 .24719 21494 .18691 .16253 .14133 .12289 .10687 .09293 .08081 .07027 .06110 16 17 18 19 20 9% OU TABLE4 Present Value of an Annuity of 1 (n) Payments 4% 5% 6% 7% 96154 .95238 94340 0.93458 1.88609 1.85941 1.83339 1.80802 2.77509 2.72325 2.67301 2.62432 4 3.62990 3.54595 3.46511 3.38721 4.45182 4.32948 4.21236 4.10020 5.24214 5.07569 4.91732 4.76654 6.00205 5.78637 5.58238 5.38929 6.73274 6.46321 6.20979 5.97130 7.43533 7.10782 6.80169 6.51523 10 8.11090 7.72173 7.36009 7.02358 11 8.76048 8.30641 7.88687 7.49867 12 9.38507 8.86325 8.38384 7.94269 13 9.98565 9.39357 8.85268 8.35765 14 10.56312 9.89864 9.29498 8.74547 15 11.11839 10.37966 9.71225 9.10791 16 11.65230 10.83777 10.10590 9.44665 17 12.16567 11.27407 10.47726 9.76322 18 12.65930 11.68959 10.82760 10.05909 19 13.13394 12.08532 11.15812 10.33560 20 13.59033 12.46221 11.46992 10.59401 min 009 8% 92593 1.78326 2.57710 3.31213 3.99271 4.62288 5.20637 5.74664 6.24689 6.71008 7.13896 7.53608 7.90378 8.24424 8.55948 8.85137 9.12164 9.37189 9.60360 9.81815 .91743 1.75911 2.53130 3.23972 3.88965 4.48592 5.03295 5.53482 5.99525 6.41766 6.80519 7.16073 7,48690 7.78615 8.06069 8.31256 8.54363 8.75563 8.95012 9.12855 10% .90909 1.73554 2.48685 3.16986 3.79079 4.35526 4.86842 5.33493 5.75902 6.14457 6.49506 6.81369 7.10336 7.36669 7.60608 7.82371 8.02155 8.2 0141 8.36492 8,51356 11% 90090 1.71252 2.44371 3.10245 3.69590 4.23054 4.71220 5.14612 5.53705 5.88923 6.20652 6.49236 6.74987 6.98187 7.19087 7.37916 7.54879 7.70162 7.83929 7.96333 12% .89286 1.69005 2.40183 3.03735 3.60478 4.11141 4.56376 4.96764 5.32825 5.65022 5.93770 6.19437 6.42355 6.62817 6.81086 6,97399 7.11963 7.24967 7.36578 7.46944 15% .86957 1.62571 2.28323 2.85498 3.35216 3.78448 4.16042 4.48732 4.77158 5.01877 5.23371 5.42062 5.58315 5.72448 5.84737 5.95424 6,04716 6.12797 6.19823 6.25933Step by Step Solution
There are 3 Steps involved in it
Step: 1

Get Instant Access to Expert-Tailored Solutions
See step-by-step solutions with expert insights and AI powered tools for academic success
Step: 2

Step: 3

Ace Your Homework with AI
Get the answers you need in no time with our AI-driven, step-by-step assistance
Get Started


