

Answered step by step
Verified Expert Solution
Question
1 Approved Answer
Question 11 2 p Using Thinkorswim, how can I view a graph of stock prices for the past few hours? None of these choices are
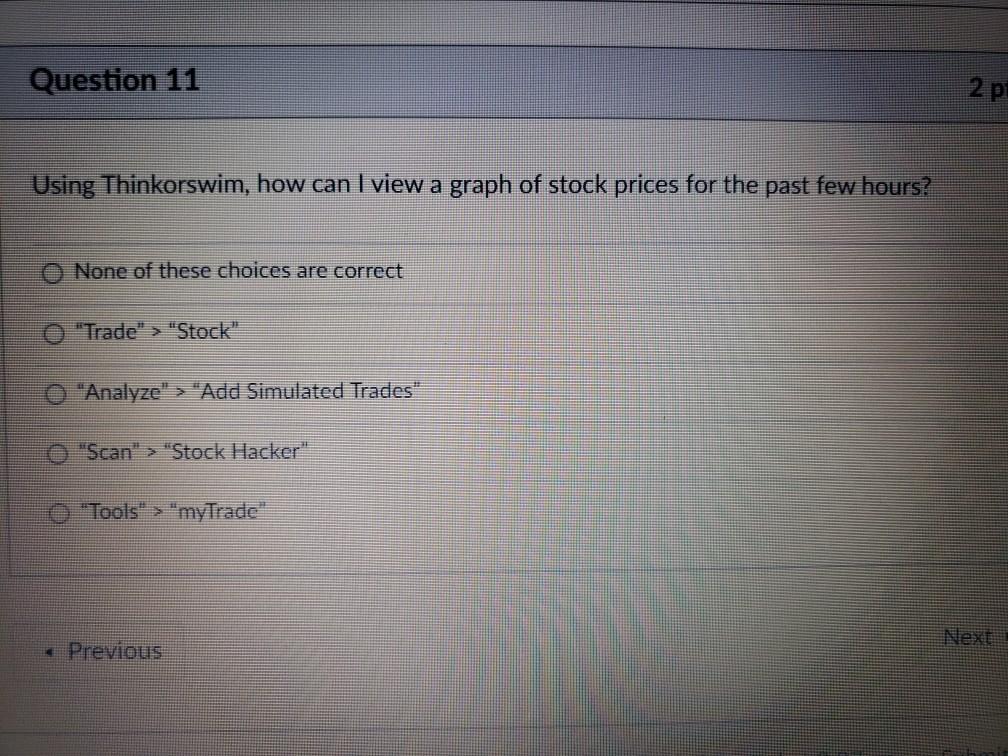
Question 11 2 p Using Thinkorswim, how can I view a graph of stock prices for the past few hours? None of these choices are correct "Trade" > "Stock" 0 "Analyze" > "Add Simulated Trades" "Scan" > "Stock Hacker "Tools" > "myTrade Next Previous
Step by Step Solution
There are 3 Steps involved in it
Step: 1

Get Instant Access to Expert-Tailored Solutions
See step-by-step solutions with expert insights and AI powered tools for academic success
Step: 2

Step: 3
Ace Your Homework with AI
Get the answers you need in no time with our AI-driven, step-by-step assistance
Get Started
Finance Ethics Critical Issues In Theory And Practice
Authors: John R. Boatright
1st Edition
0631214275, 978-0631214274