Answered step by step
Verified Expert Solution
Question
1 Approved Answer
Question 11 A small service station notices that quantity (q) of fuel they sell varies with the price (p) they charge per litre. The supply
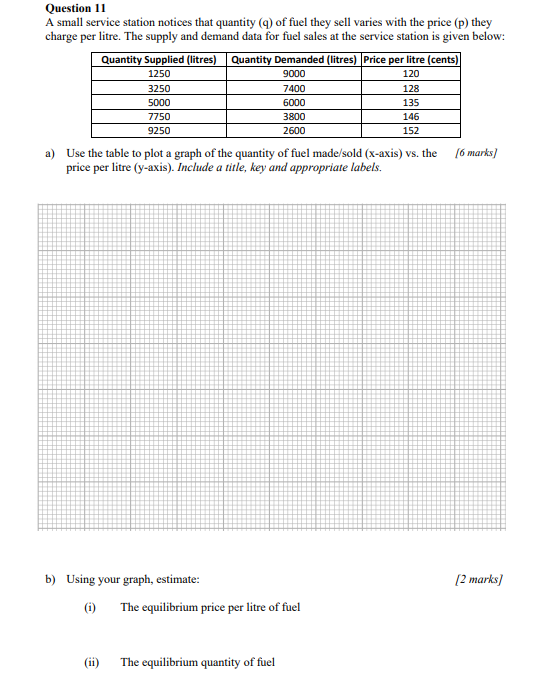
Question 11 A small service station notices that quantity (q) of fuel they sell varies with the price (p) they charge per litre. The supply and demand data for fuel sales at the service station is given below: Quantity Supplied (litres) Quantity Demanded (litres) Price per litre (cents) 1250 3250 5000 7750 9250 9000 7400 6000 3800 2600 120 128 135 146 152 16 marks a) Use the table to plot a graph of the quantity of fuel made/sold (x-axis) vs. the price per litre (y-axis). Include a title, key and appropriate labels. [2 marks) b) Using your graph, estimate: (1) The equilibrium price per litre of fuel (ii) The equilibrium quantity of fuel c) Find the demand equation for fuel sales. [4 marks) Question 11 A small service station notices that quantity (q) of fuel they sell varies with the price (p) they charge per litre. The supply and demand data for fuel sales at the service station is given below: Quantity Supplied (litres) Quantity Demanded (litres) Price per litre (cents) 1250 3250 5000 7750 9250 9000 7400 6000 3800 2600 120 128 135 146 152 16 marks a) Use the table to plot a graph of the quantity of fuel made/sold (x-axis) vs. the price per litre (y-axis). Include a title, key and appropriate labels. [2 marks) b) Using your graph, estimate: (1) The equilibrium price per litre of fuel (ii) The equilibrium quantity of fuel c) Find the demand equation for fuel sales. [4 marks)
Step by Step Solution
There are 3 Steps involved in it
Step: 1
Get Instant Access to Expert-Tailored Solutions
See step-by-step solutions with expert insights and AI powered tools for academic success
Step: 2
Step: 3
Ace Your Homework with AI
Get the answers you need in no time with our AI-driven, step-by-step assistance
Get Started