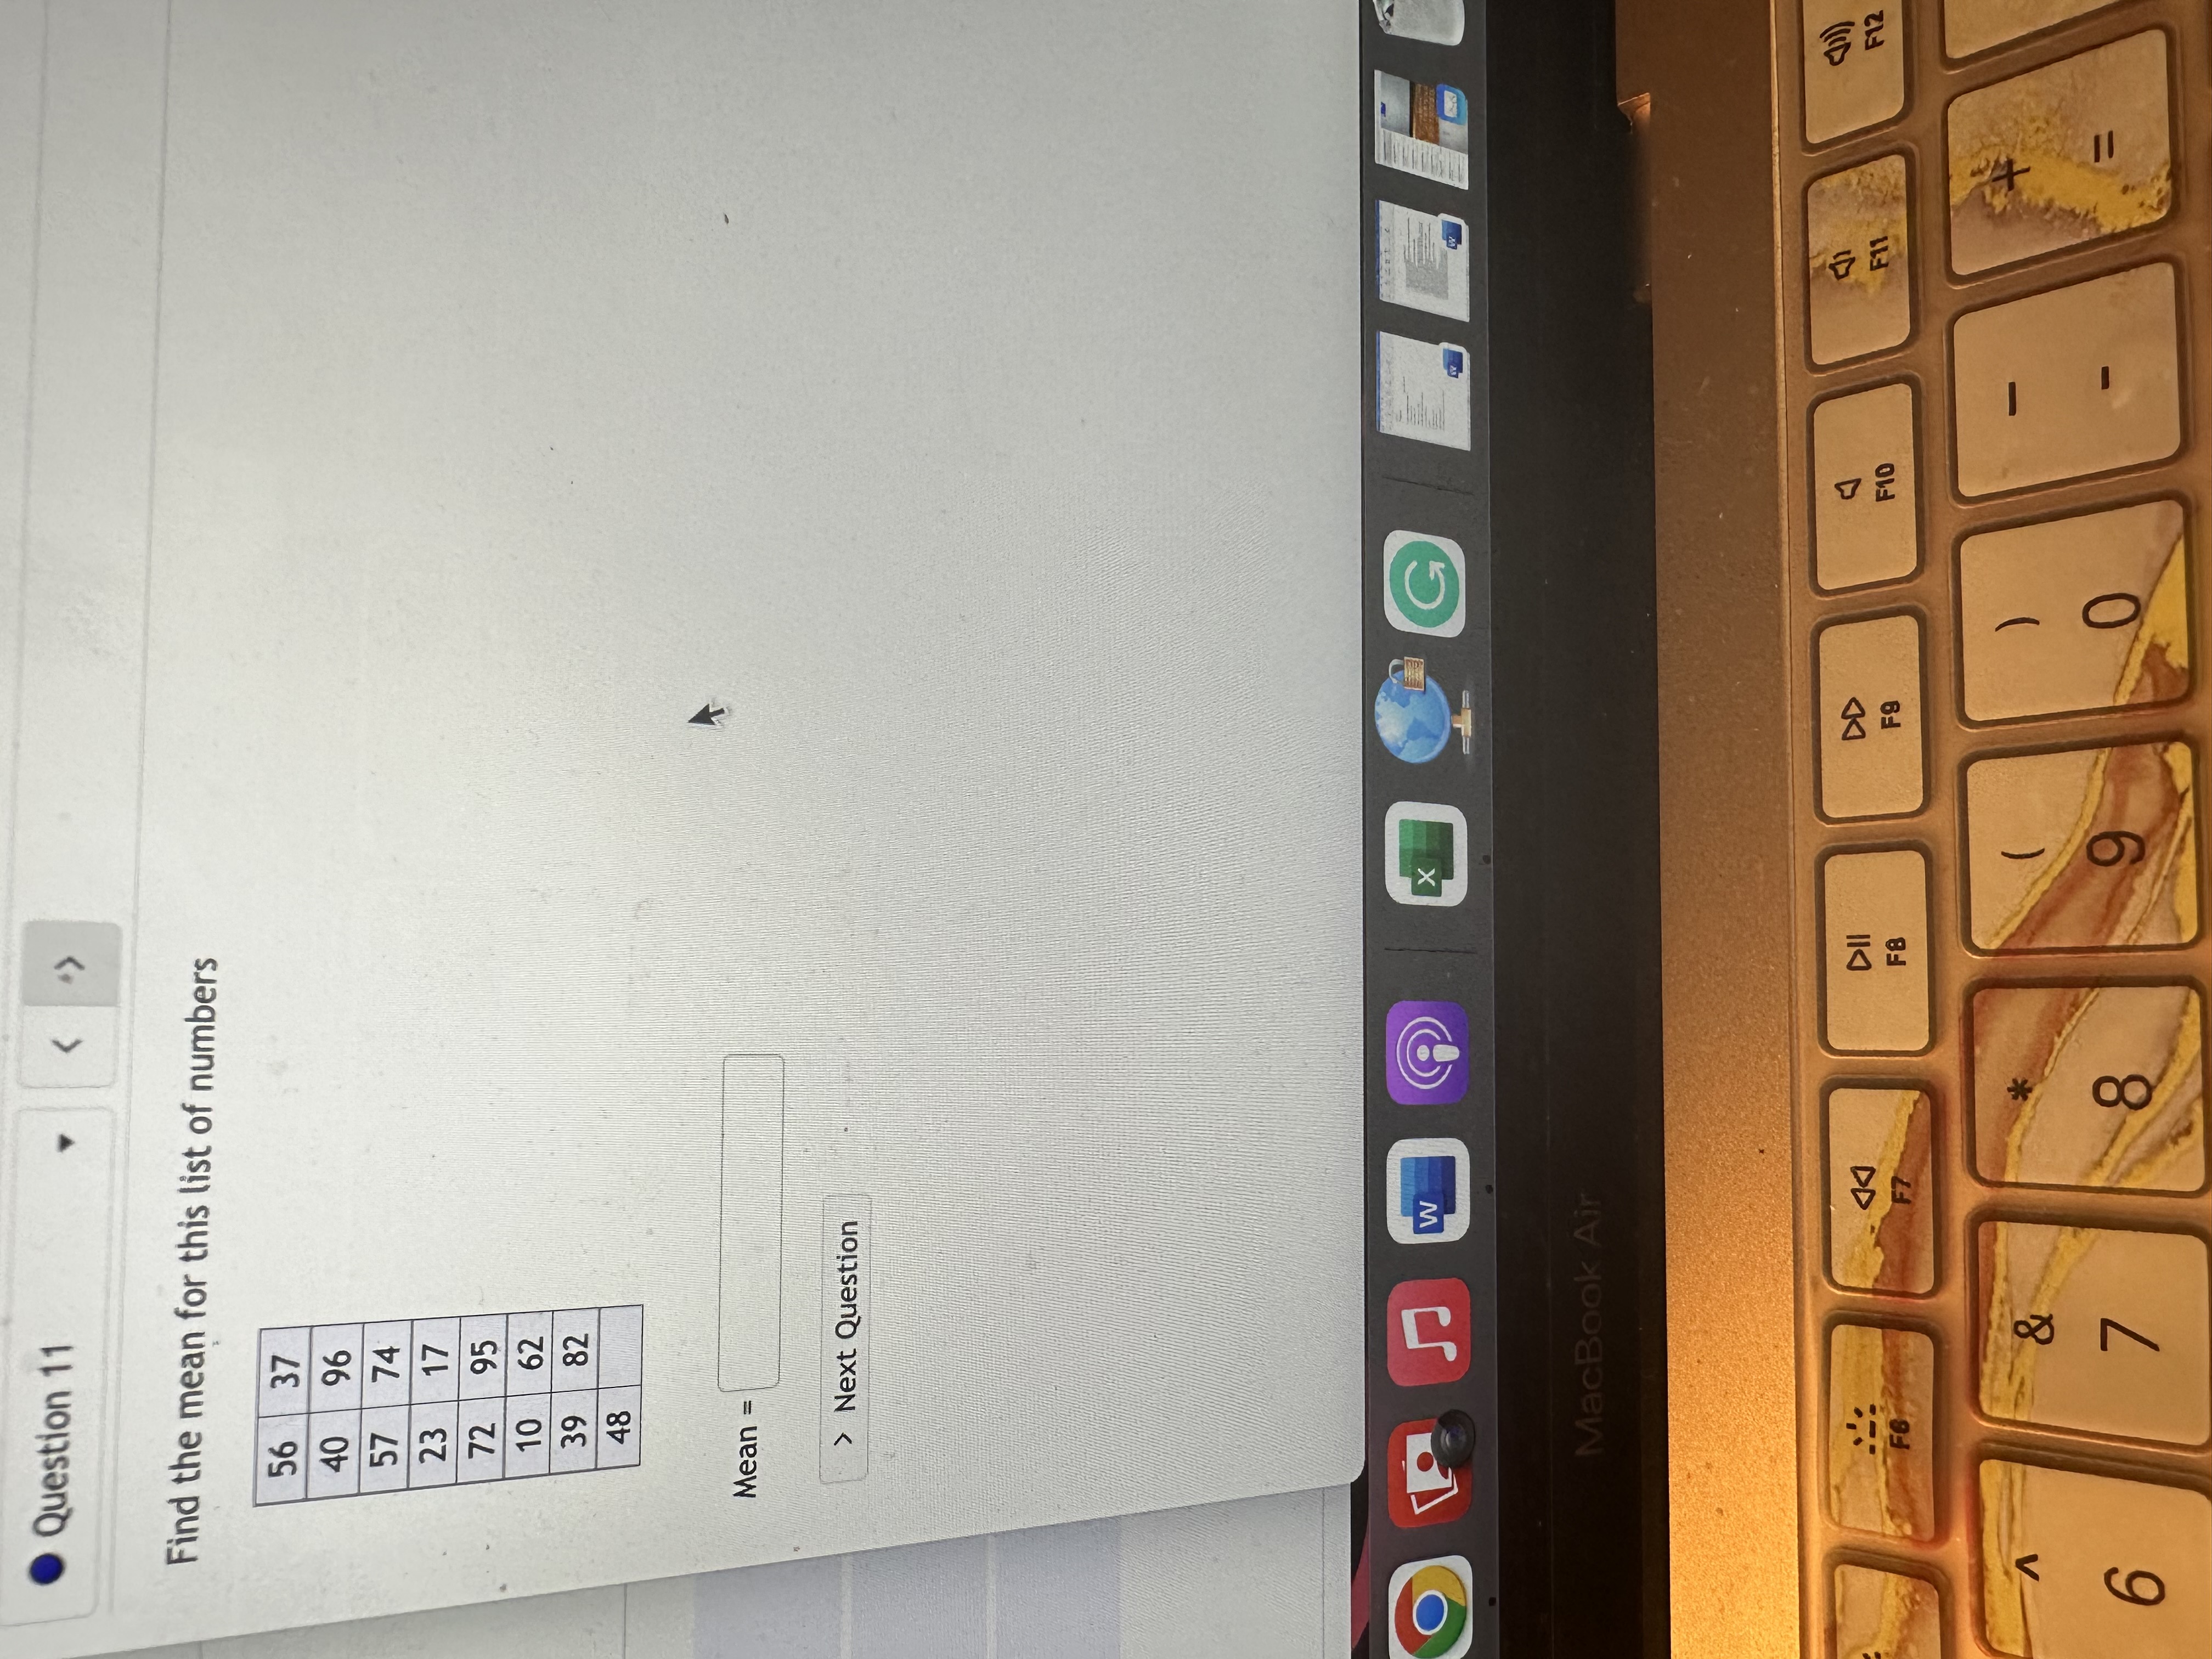
. Question 11 Find the mean for this list of numbers 56 37 40 96 57 74 23 17 72 95 10 62 39 82
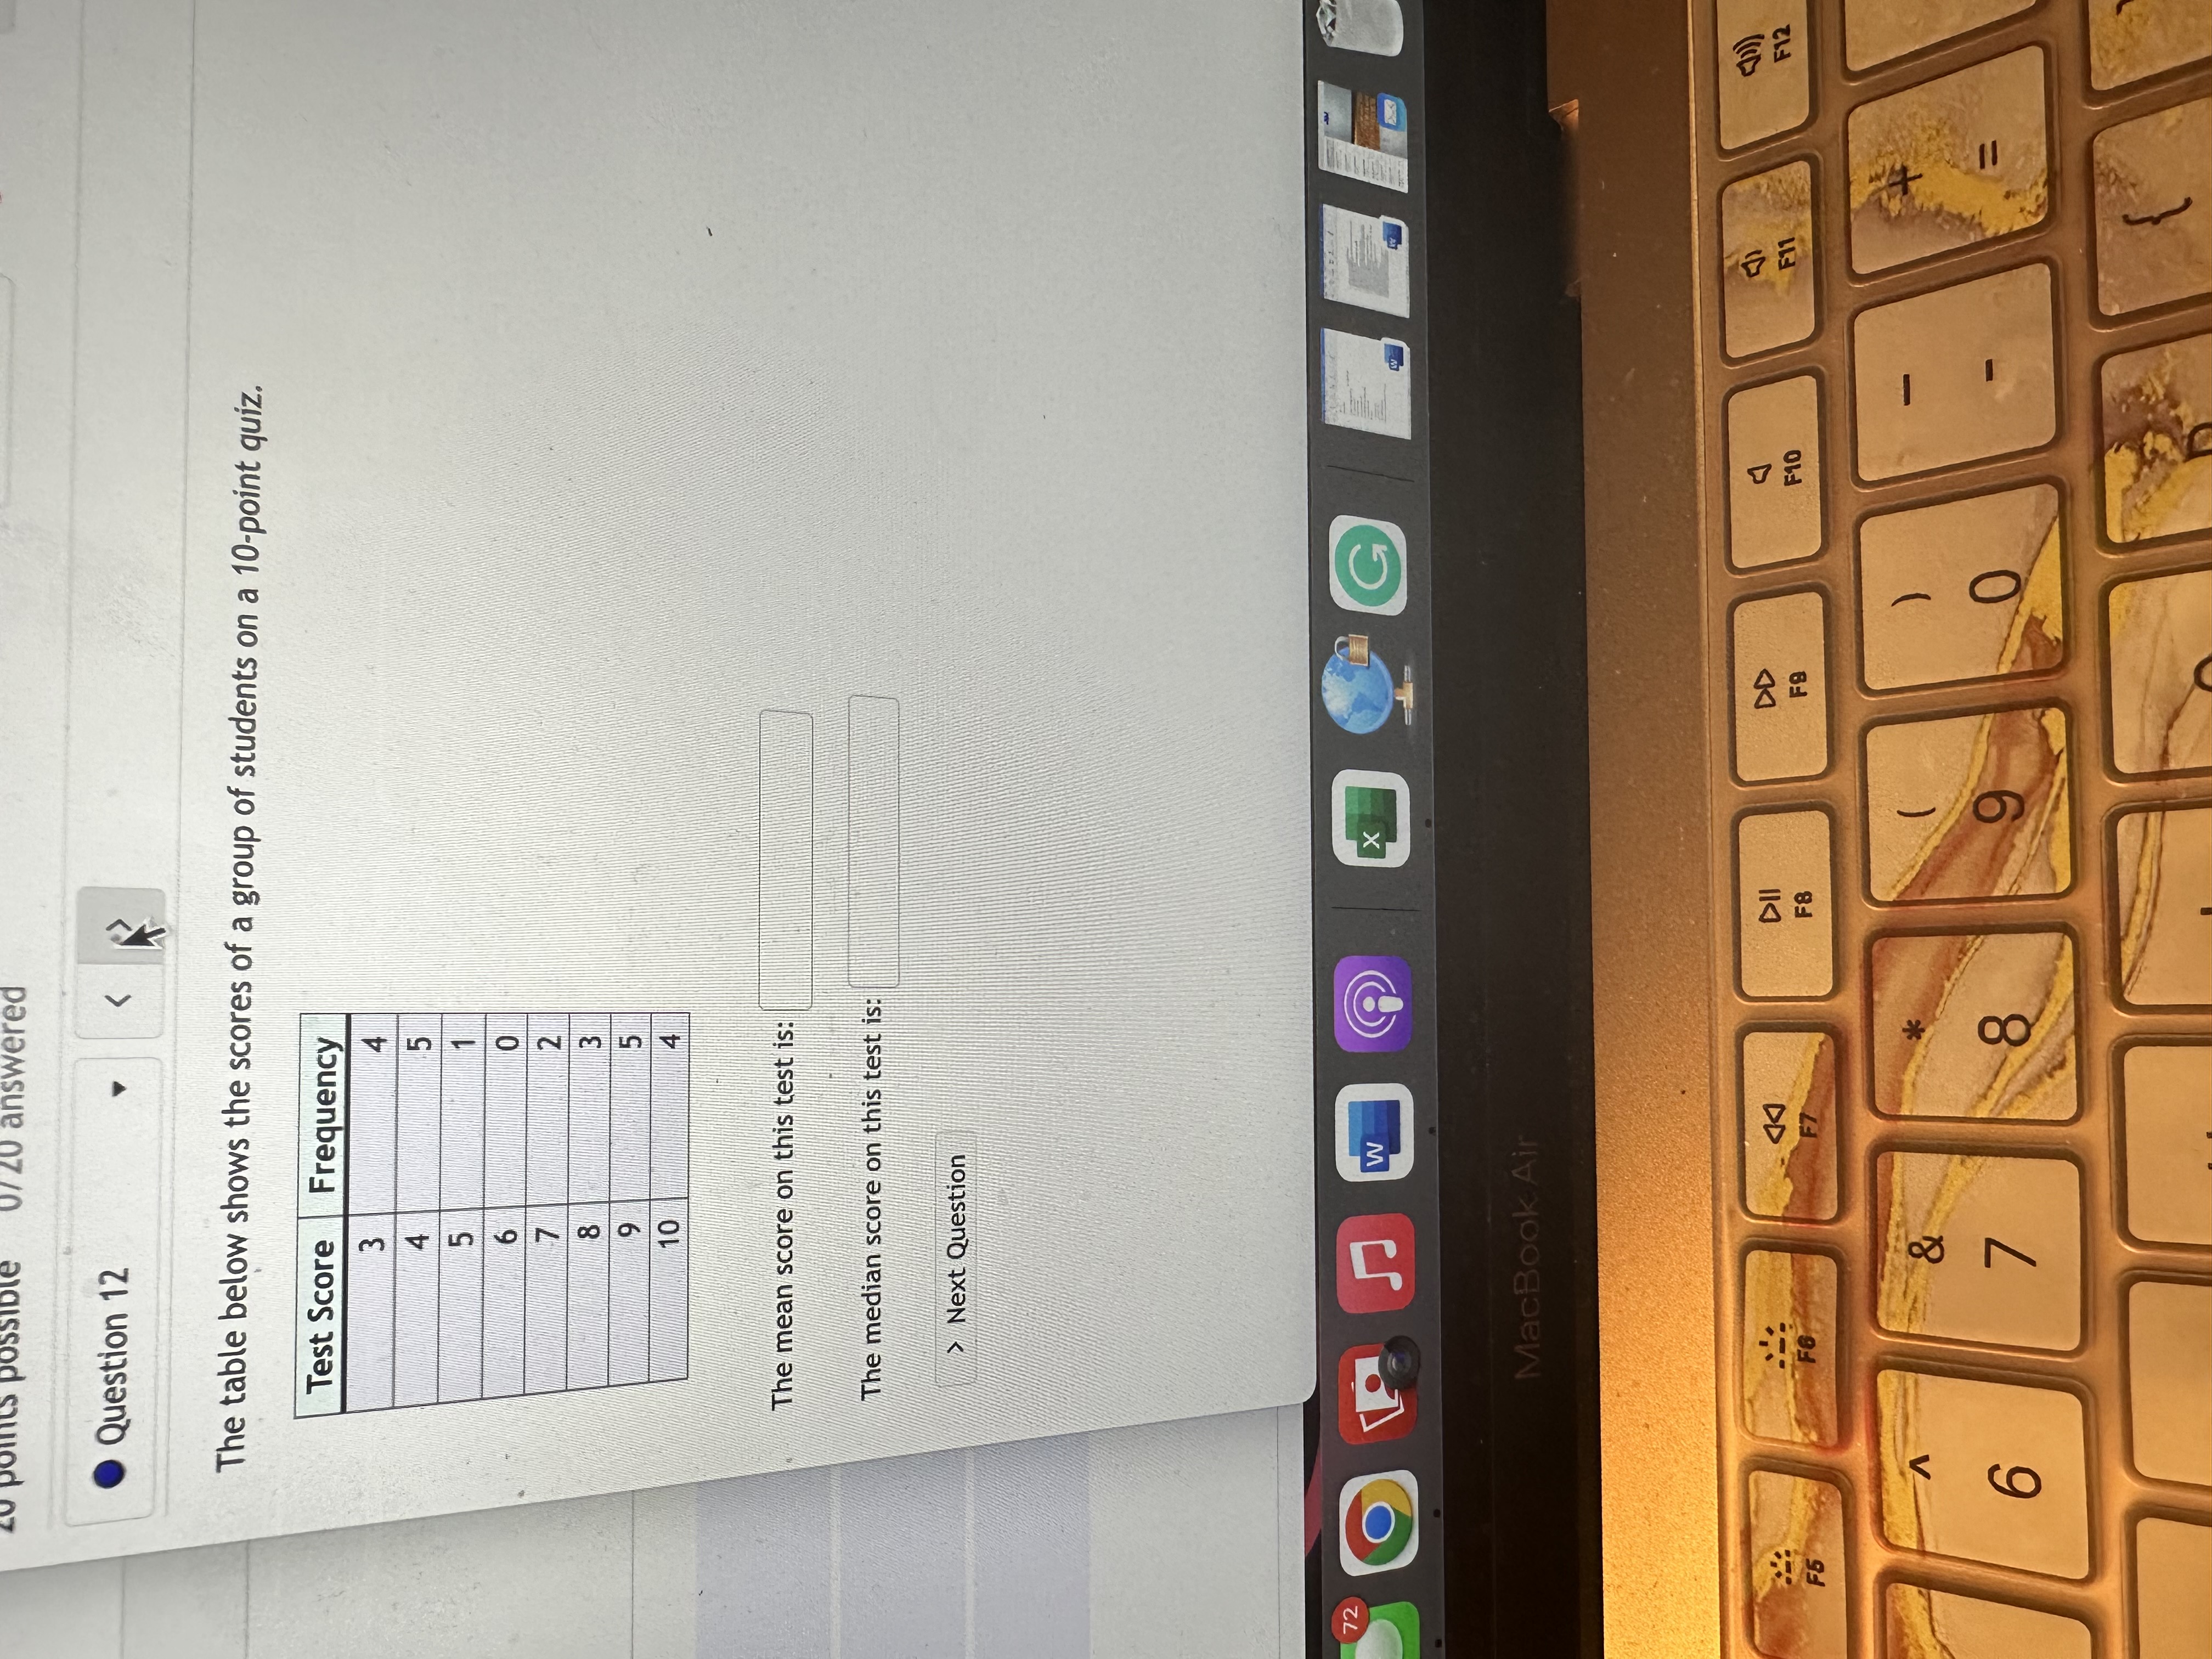
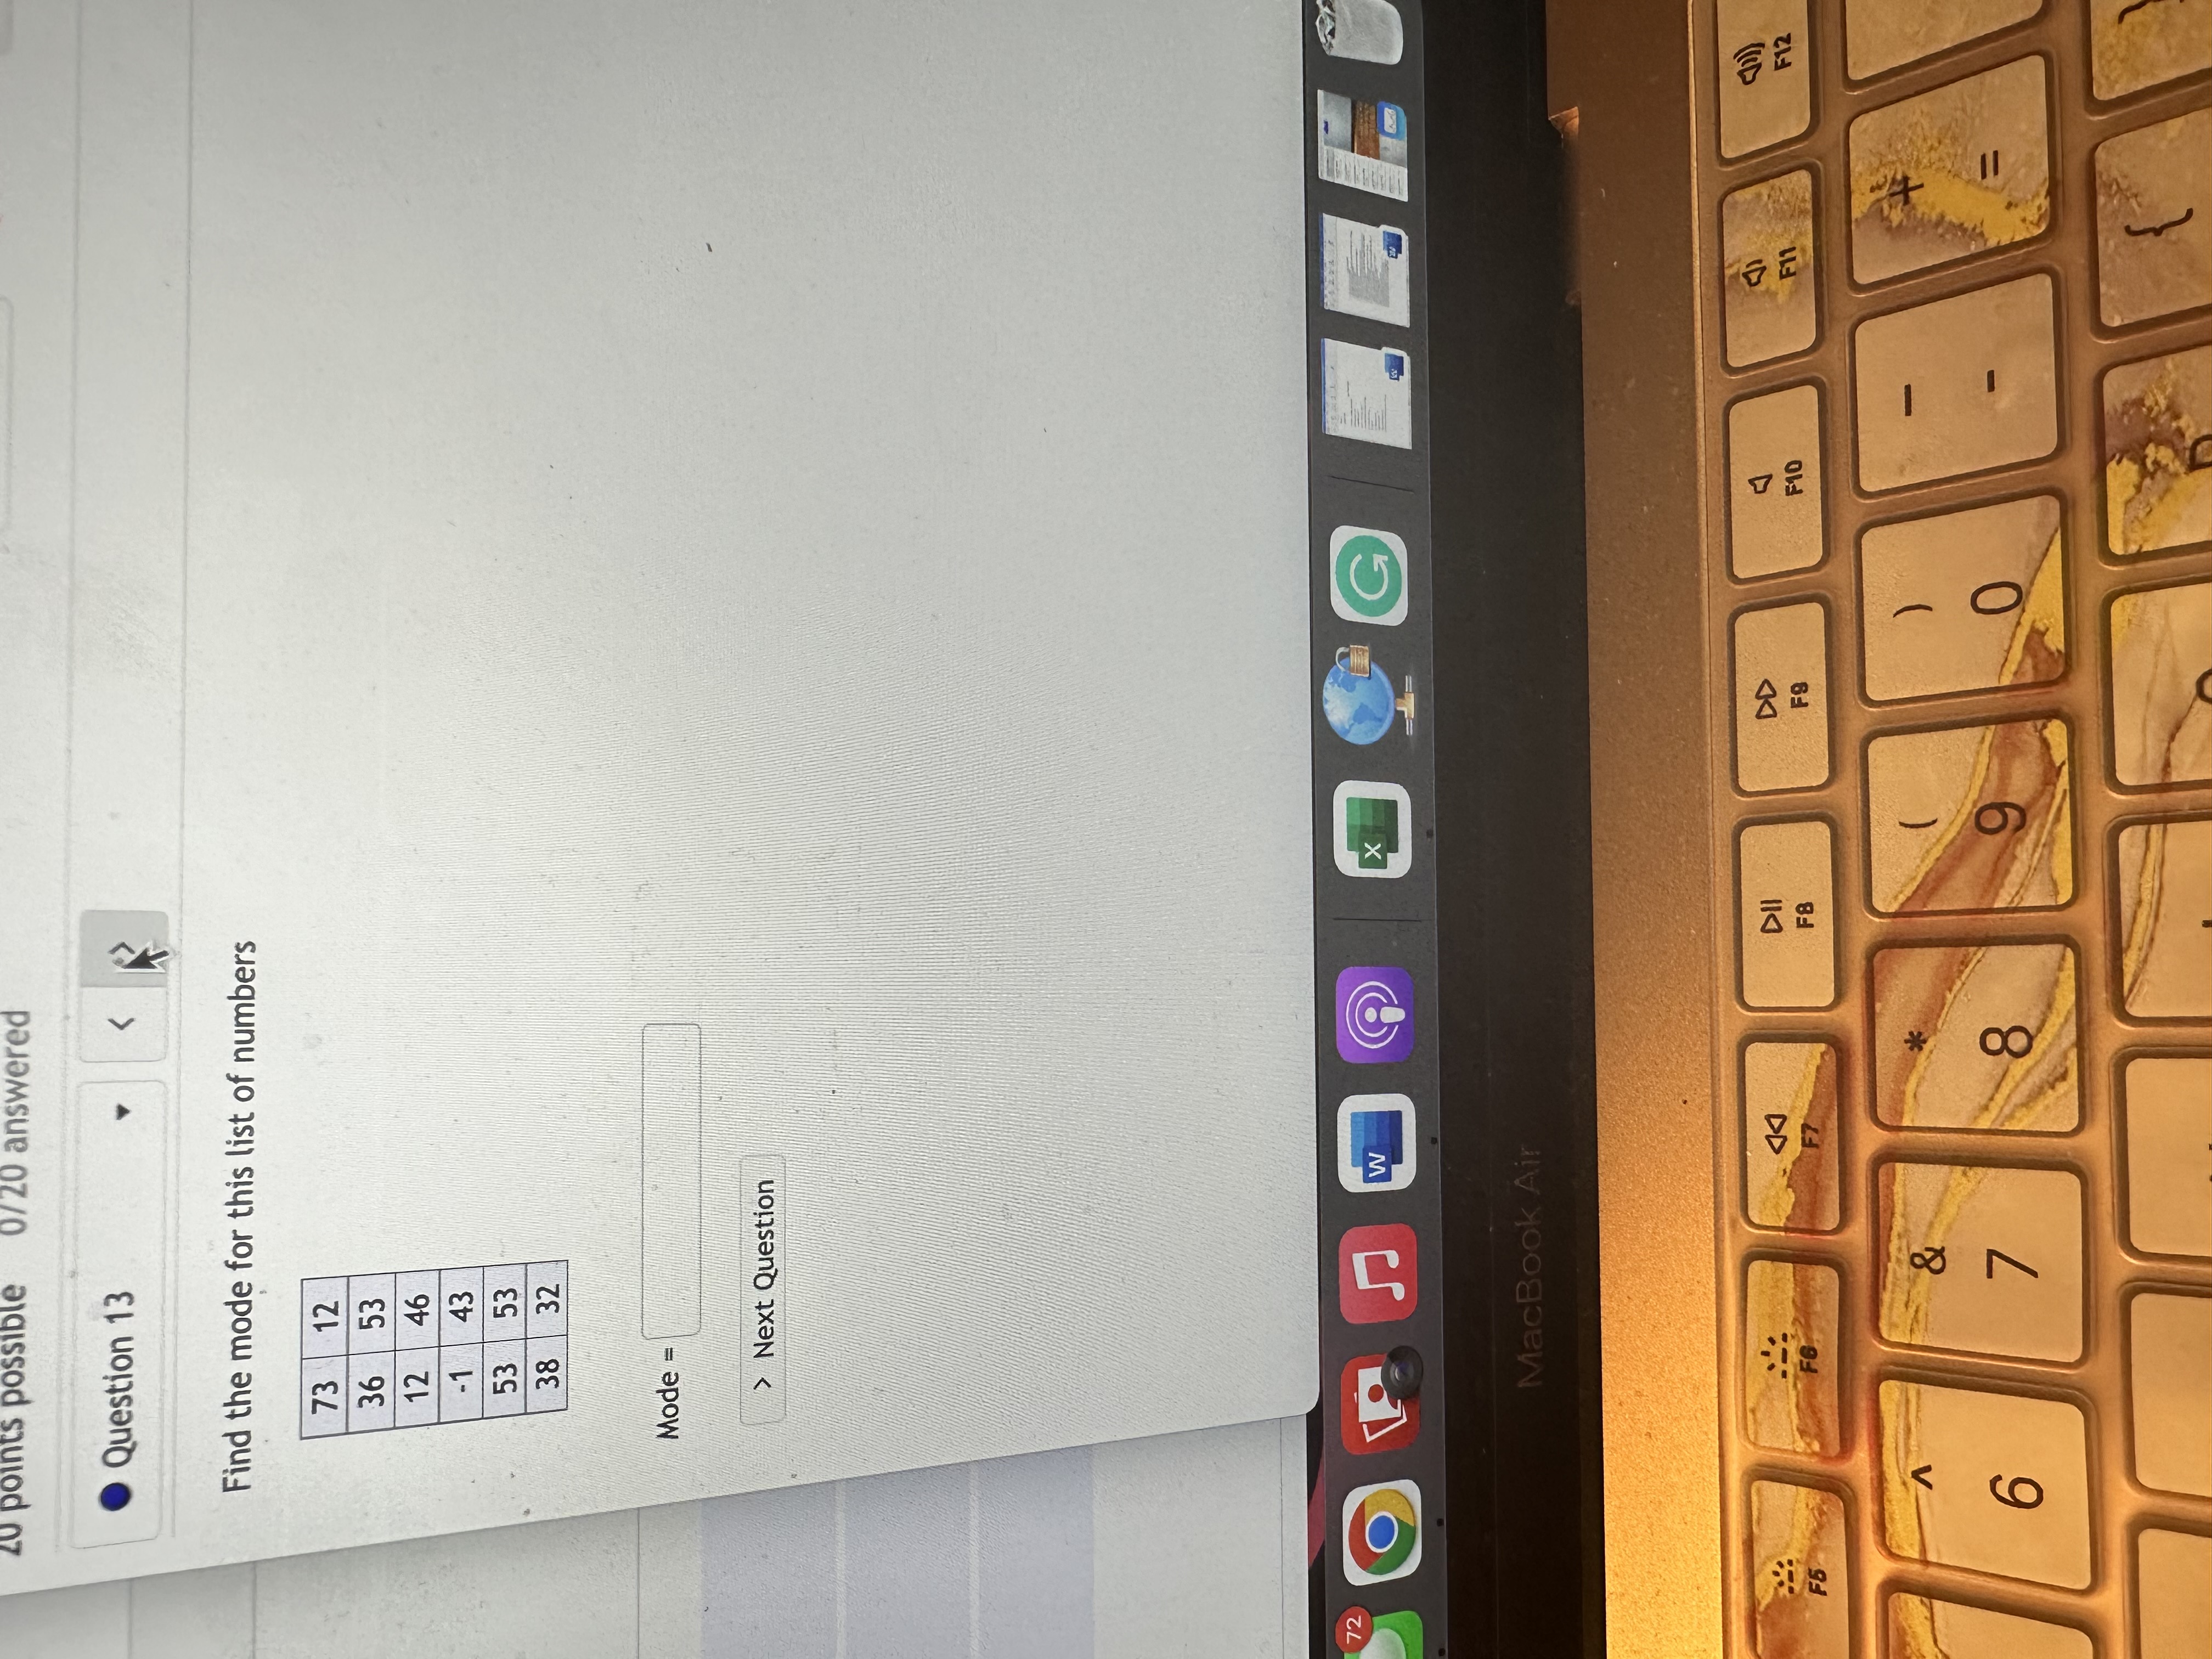
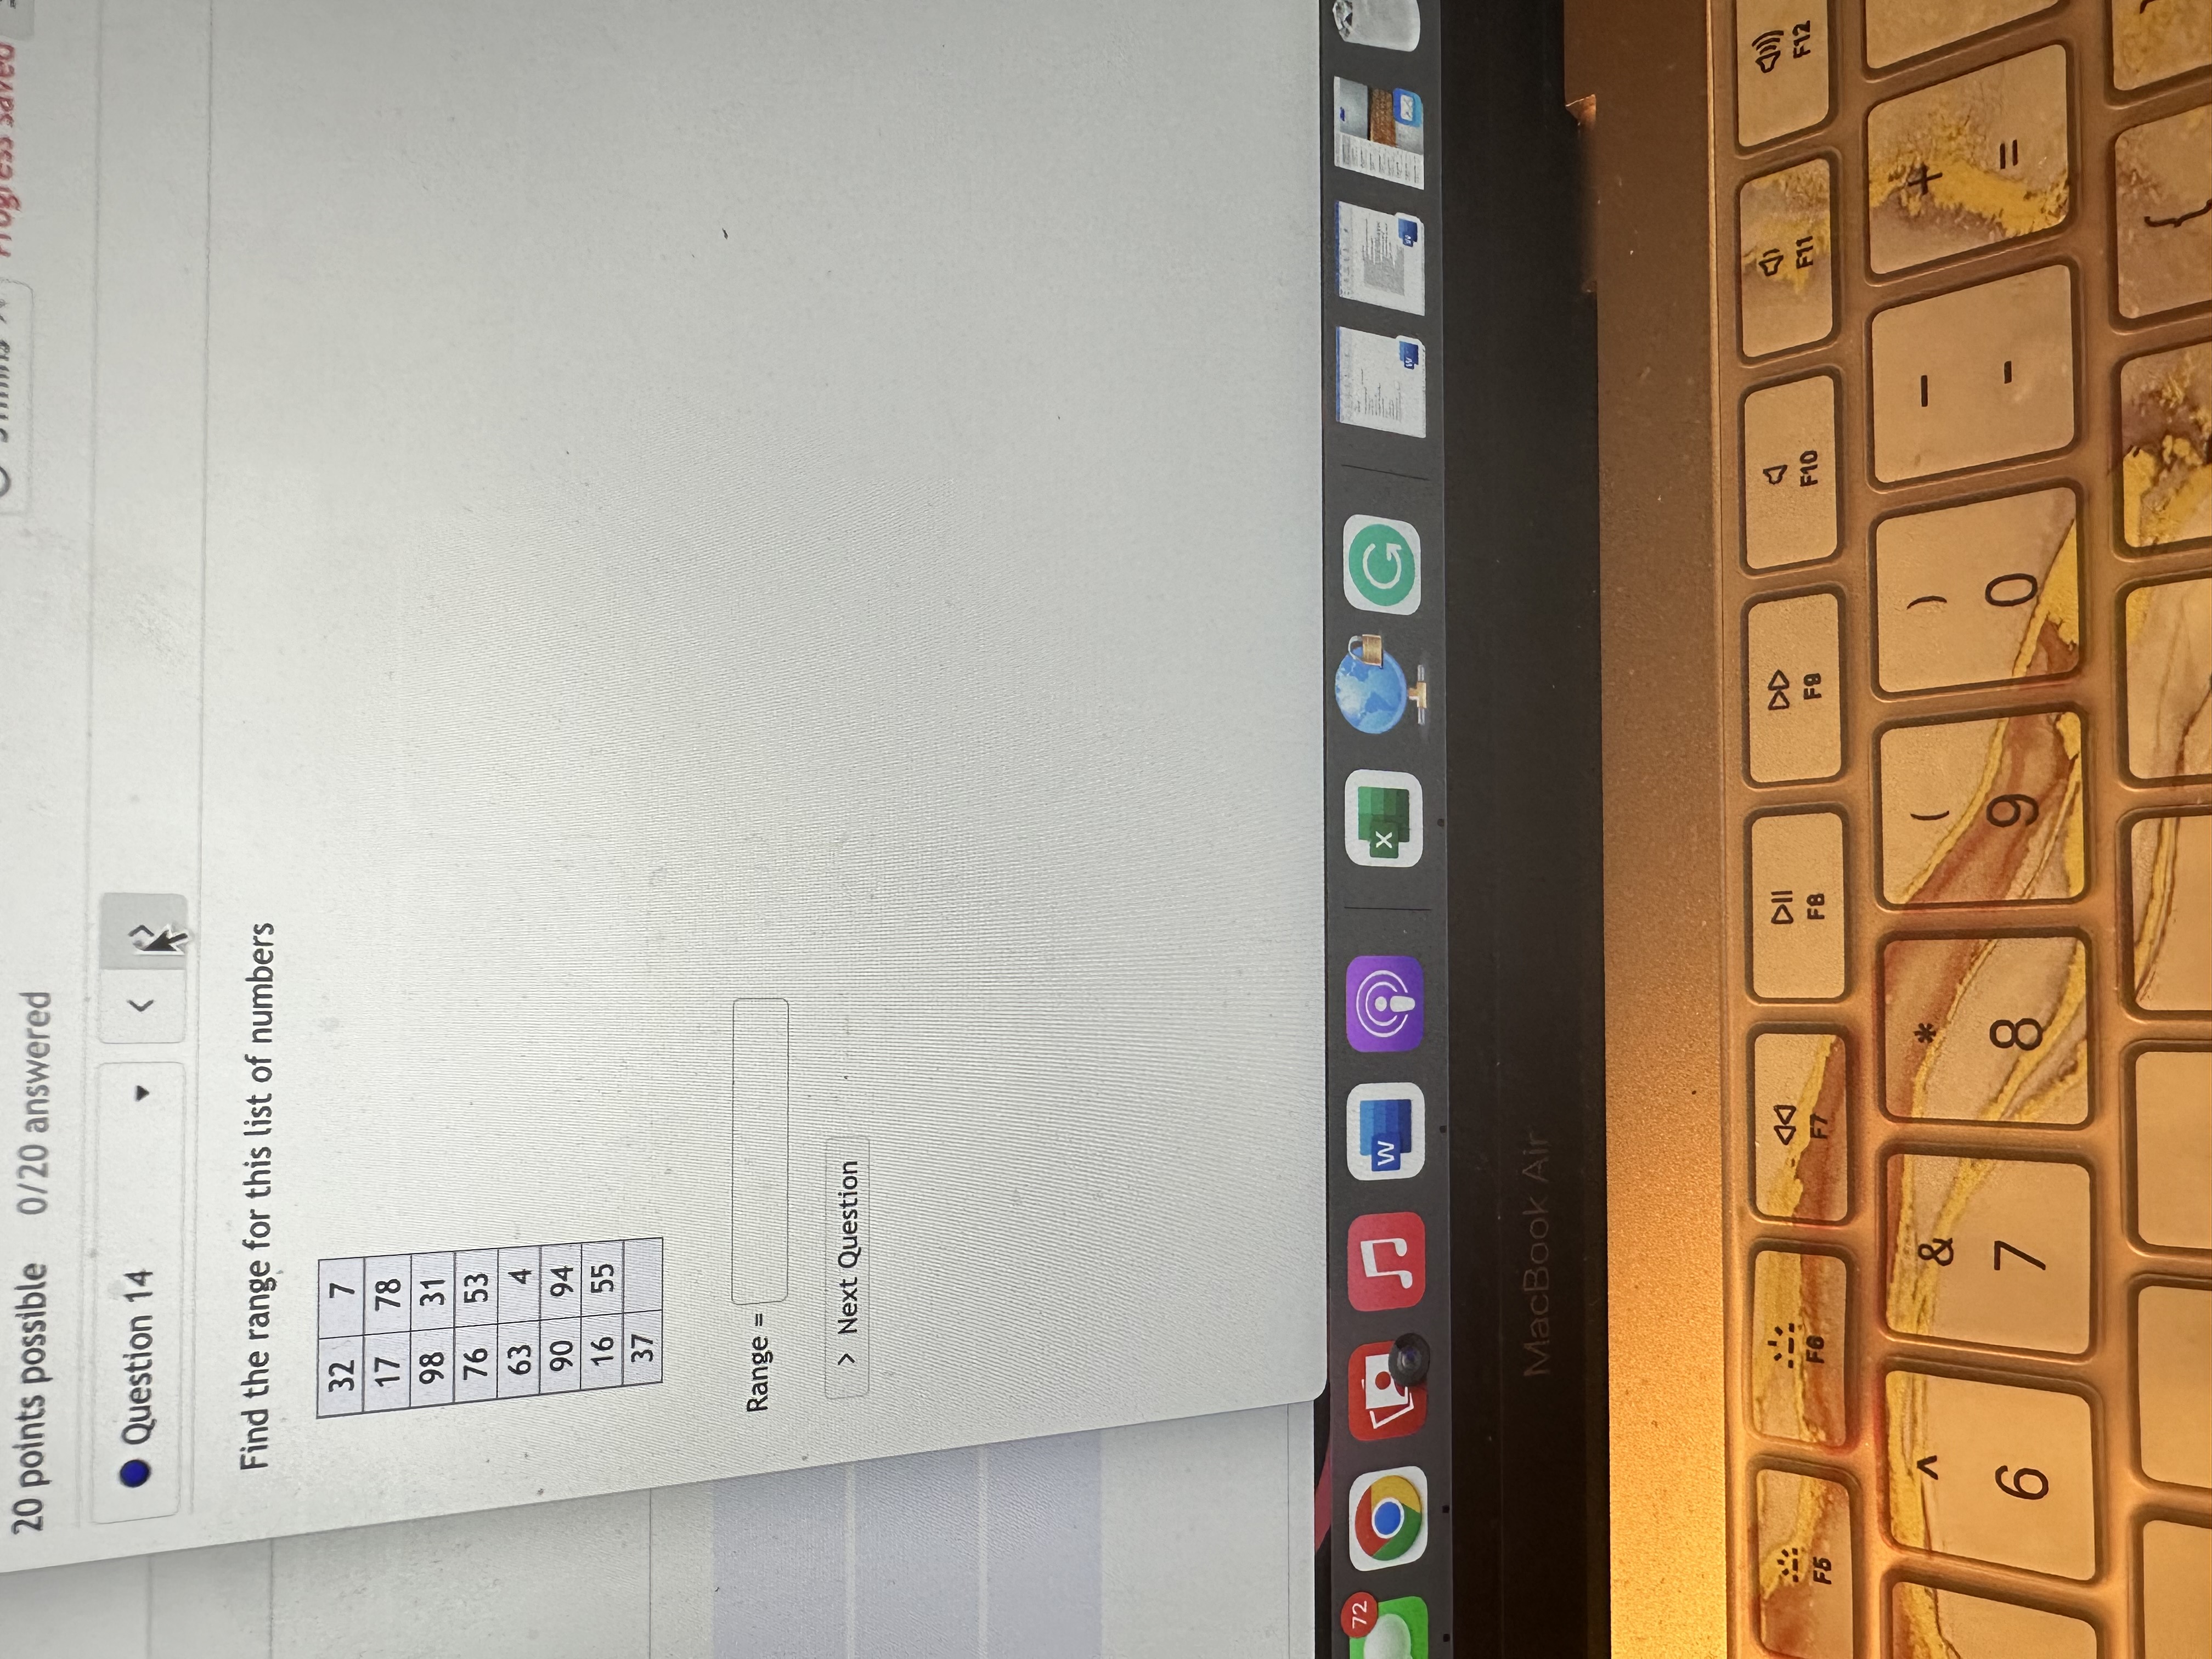
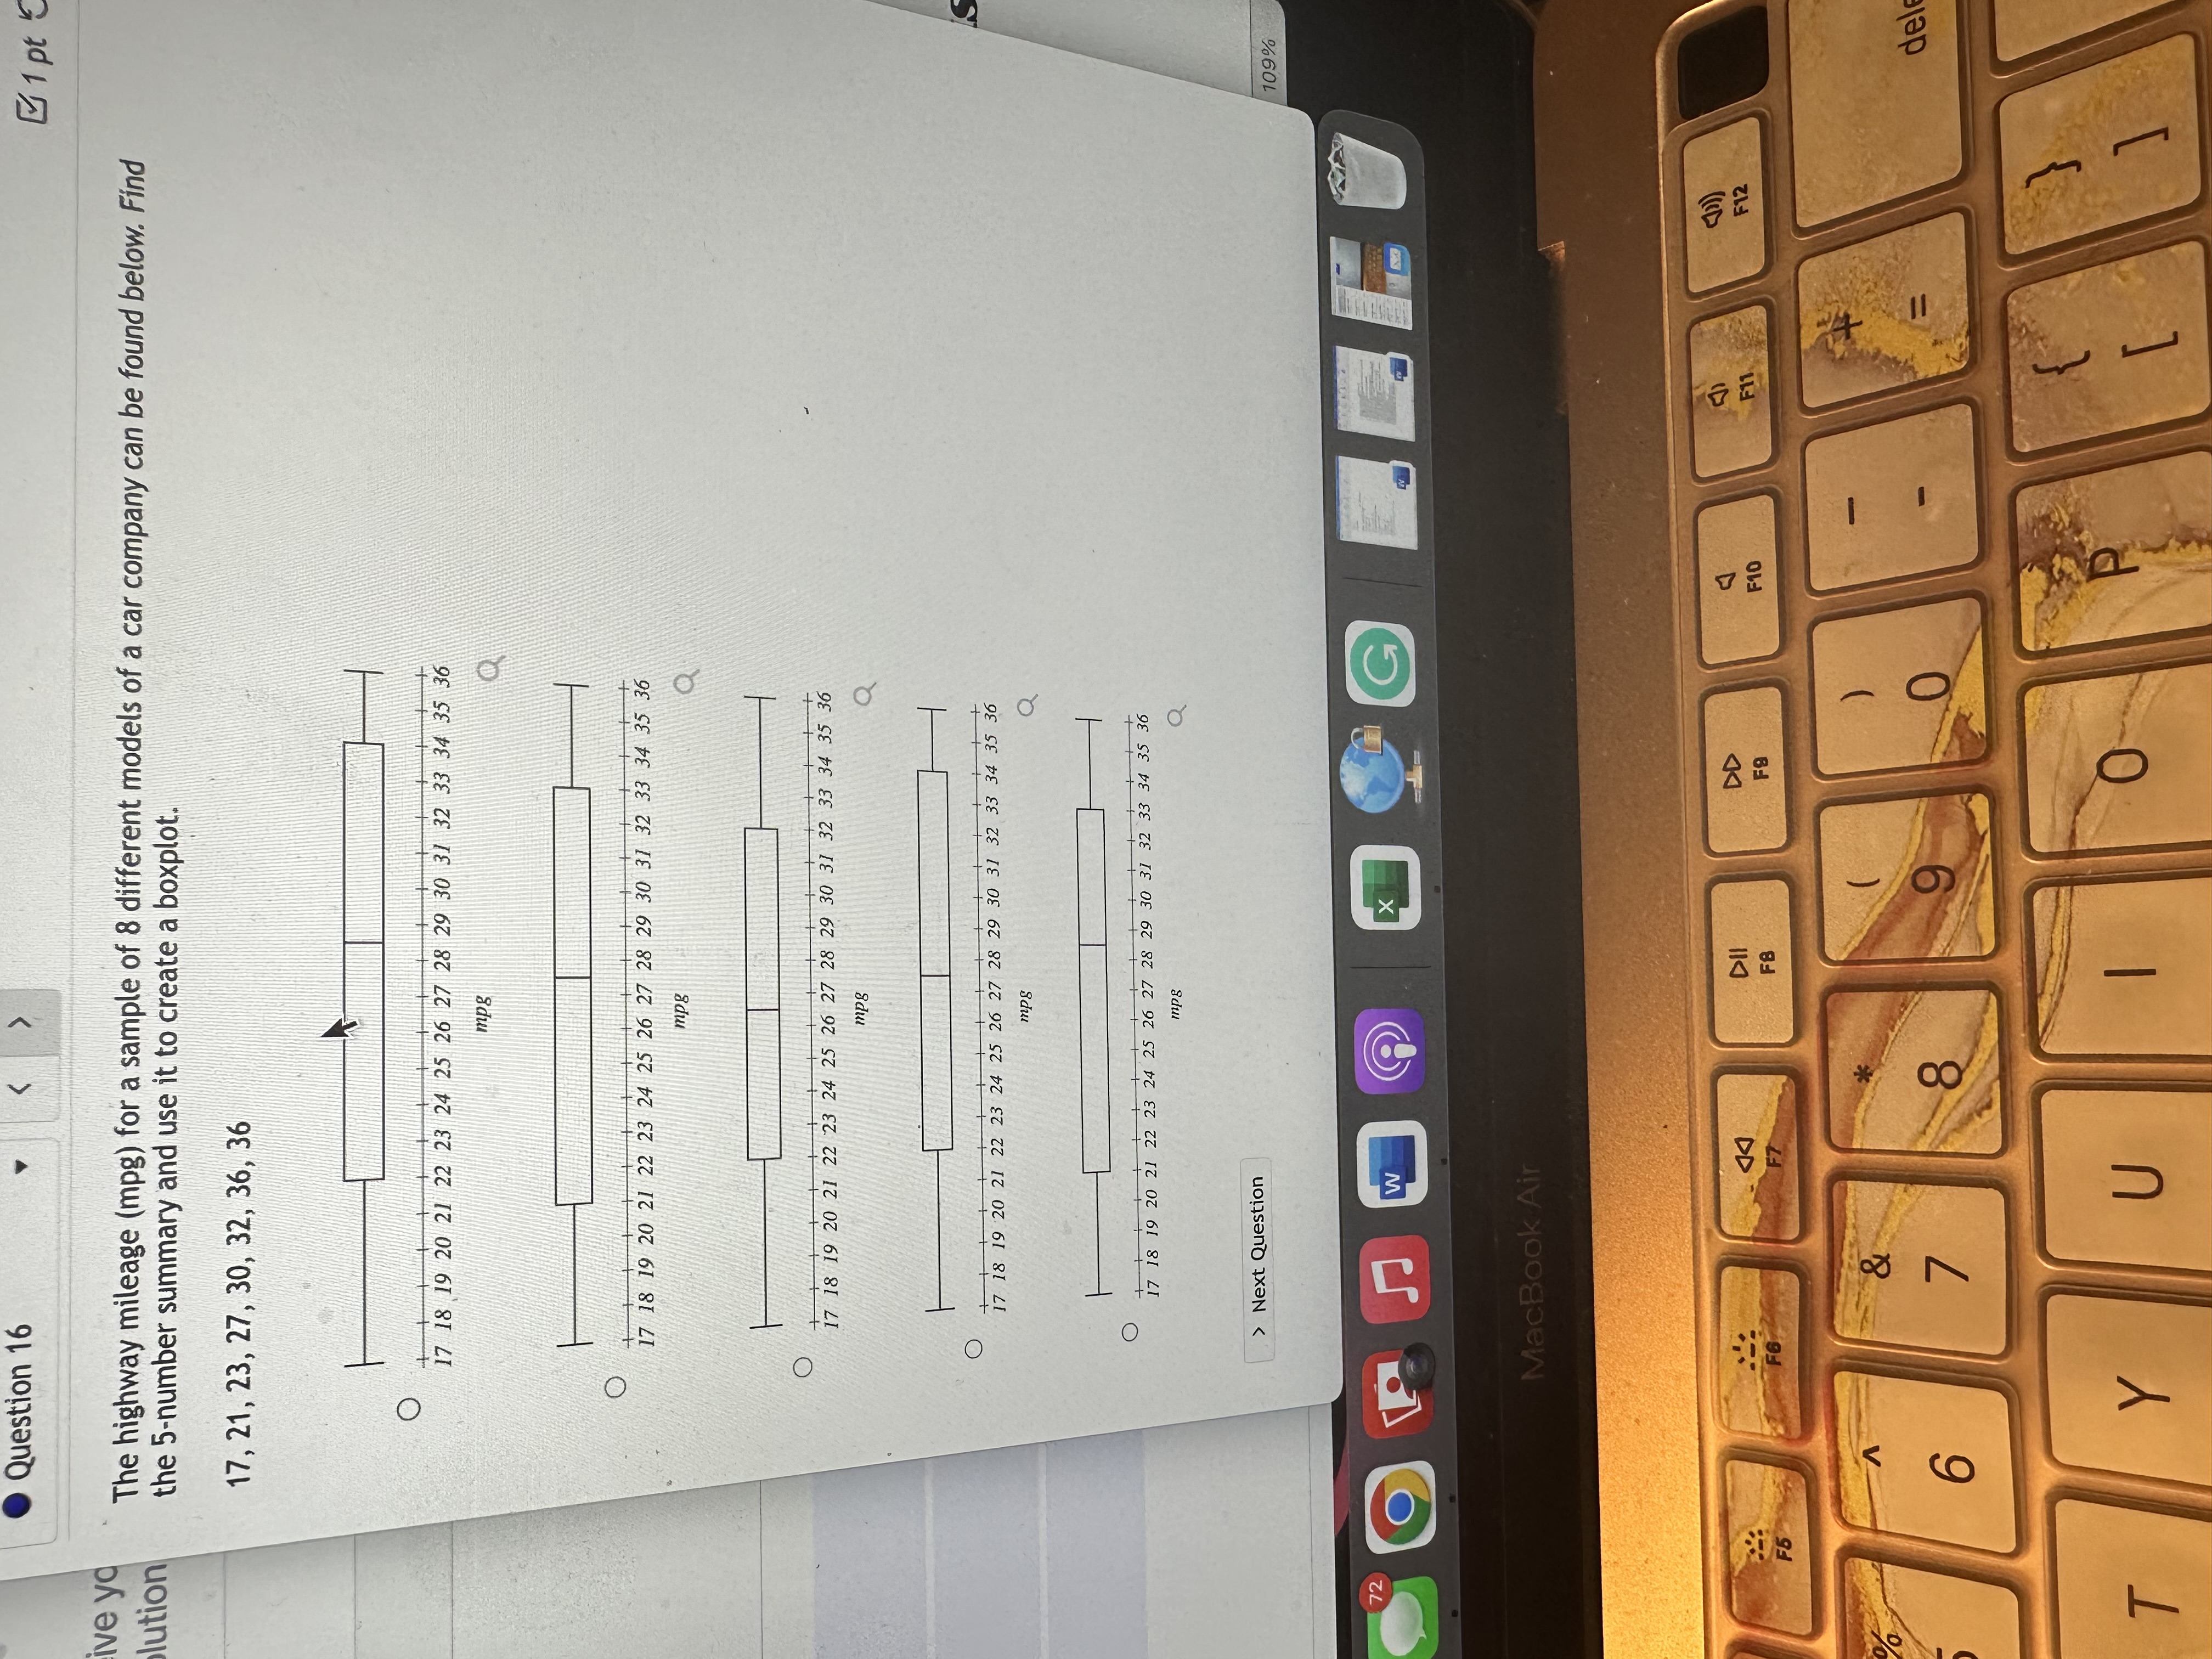
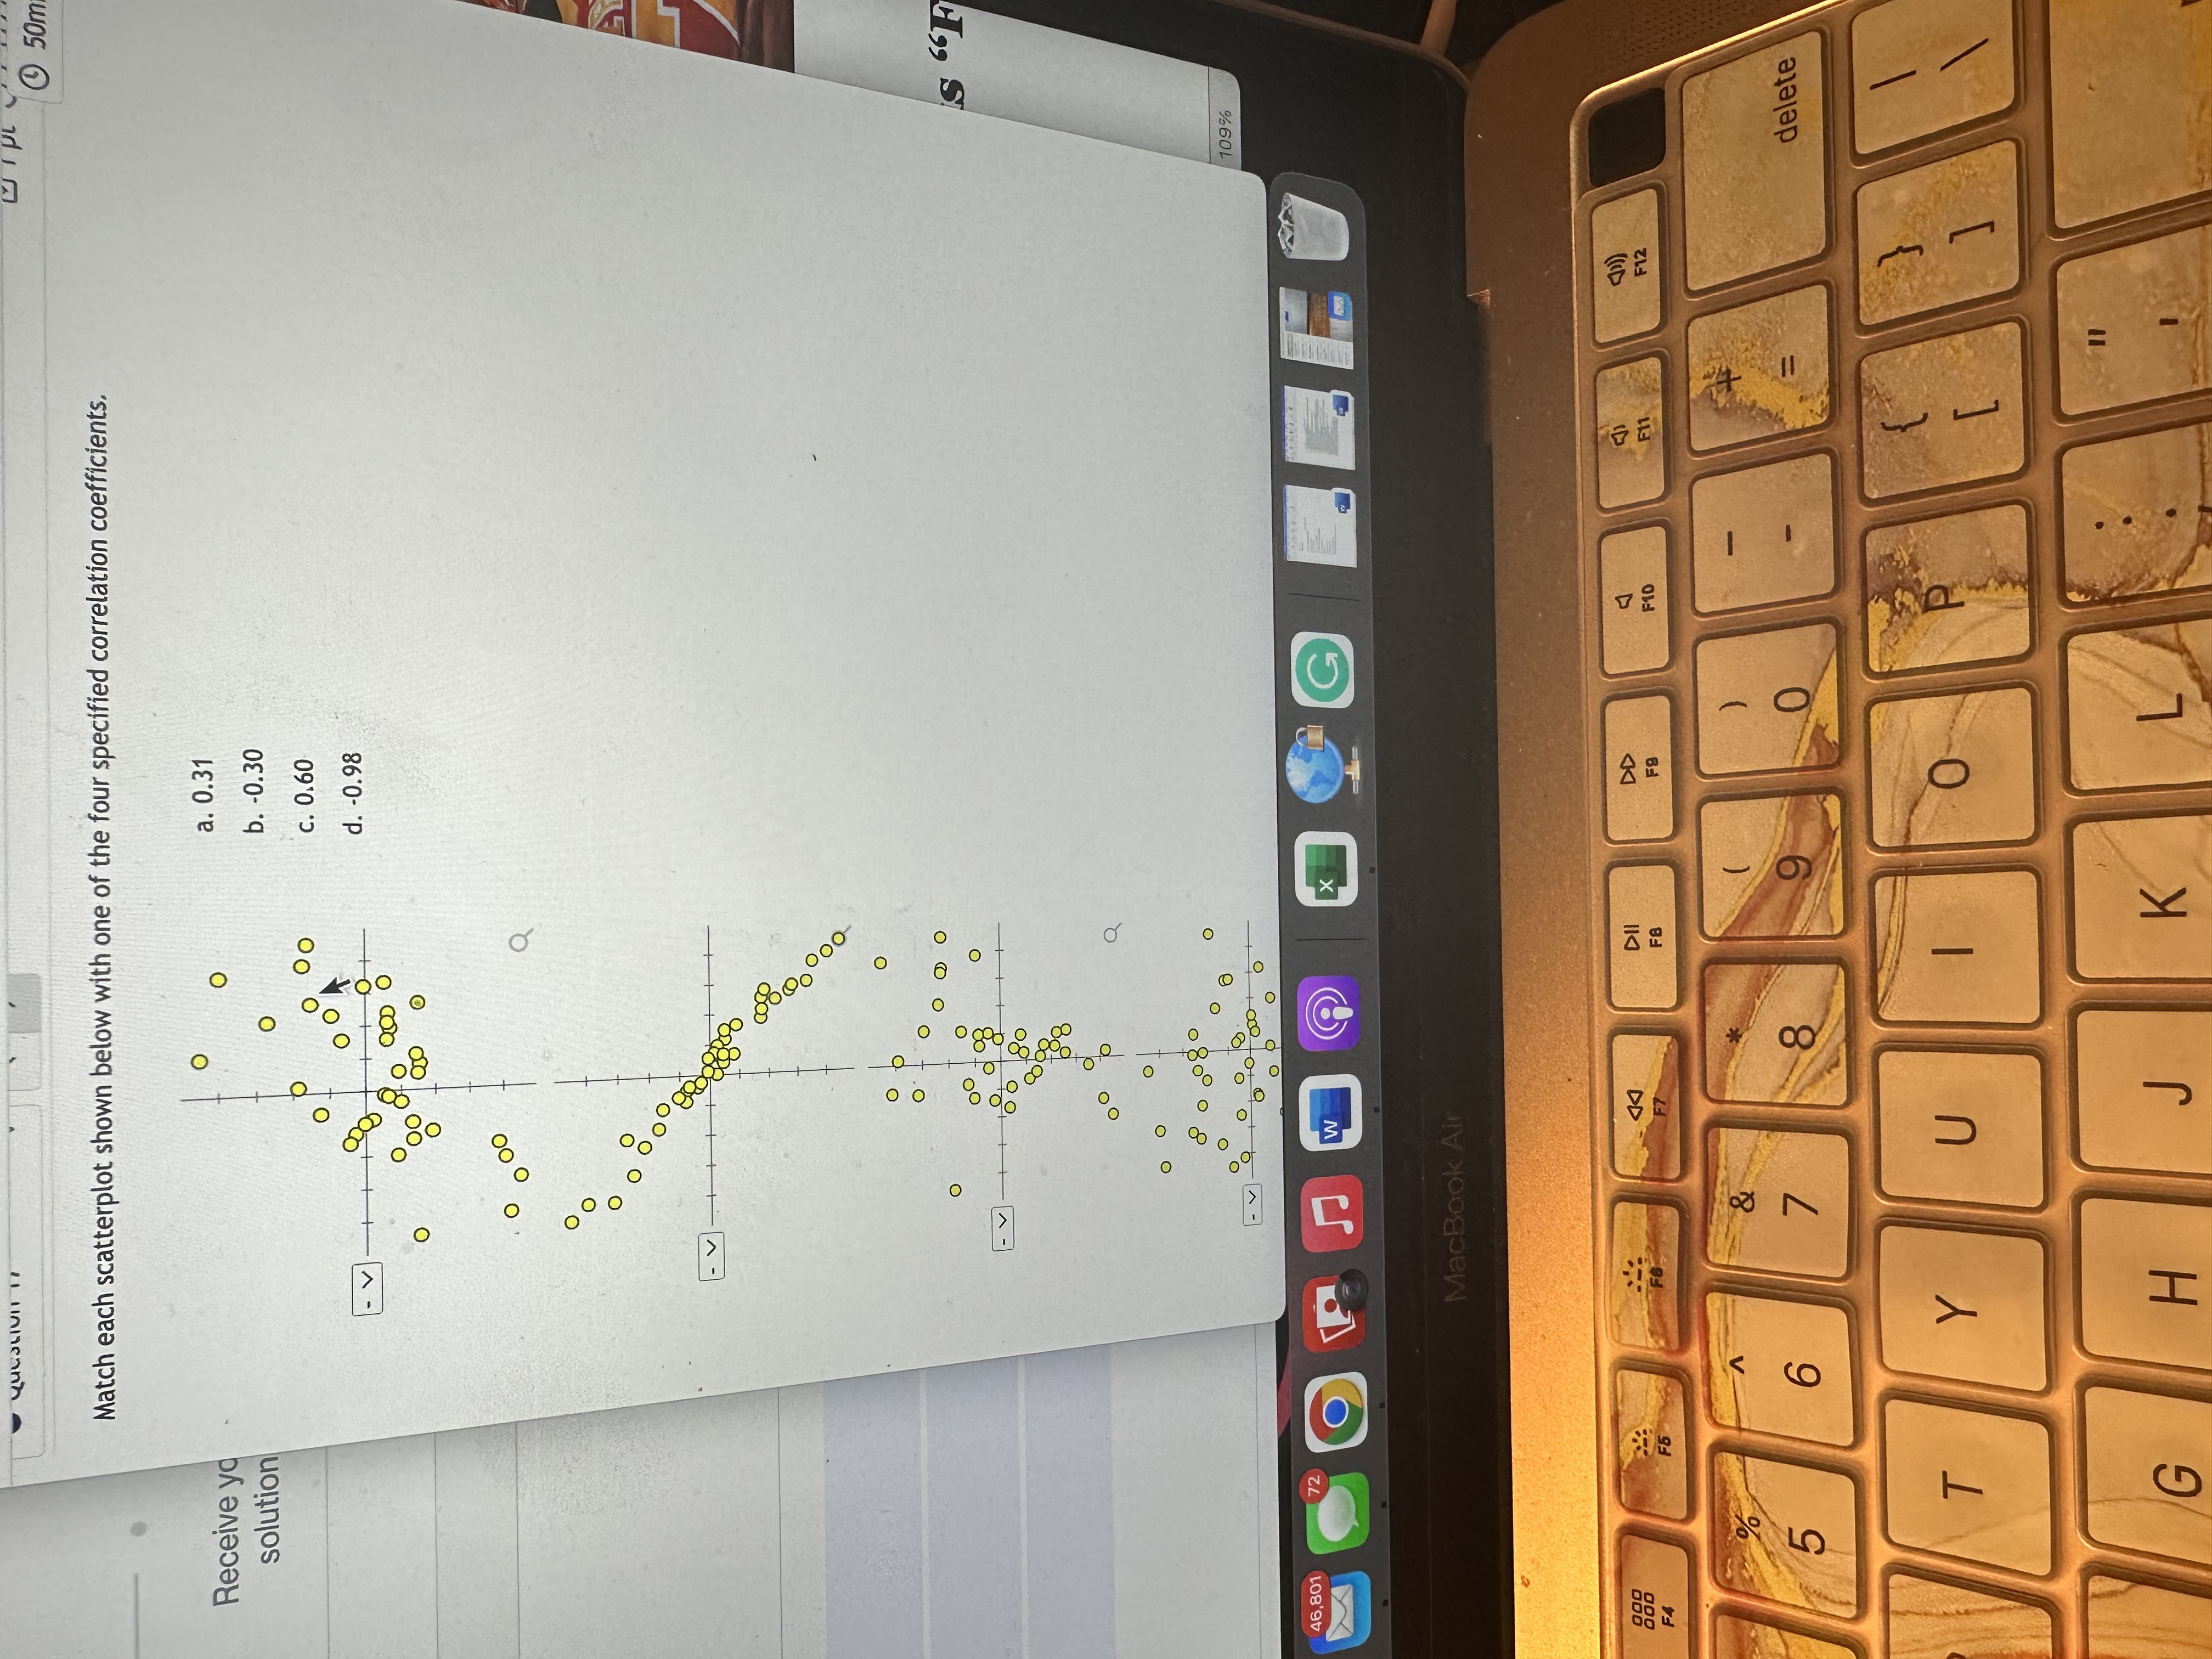
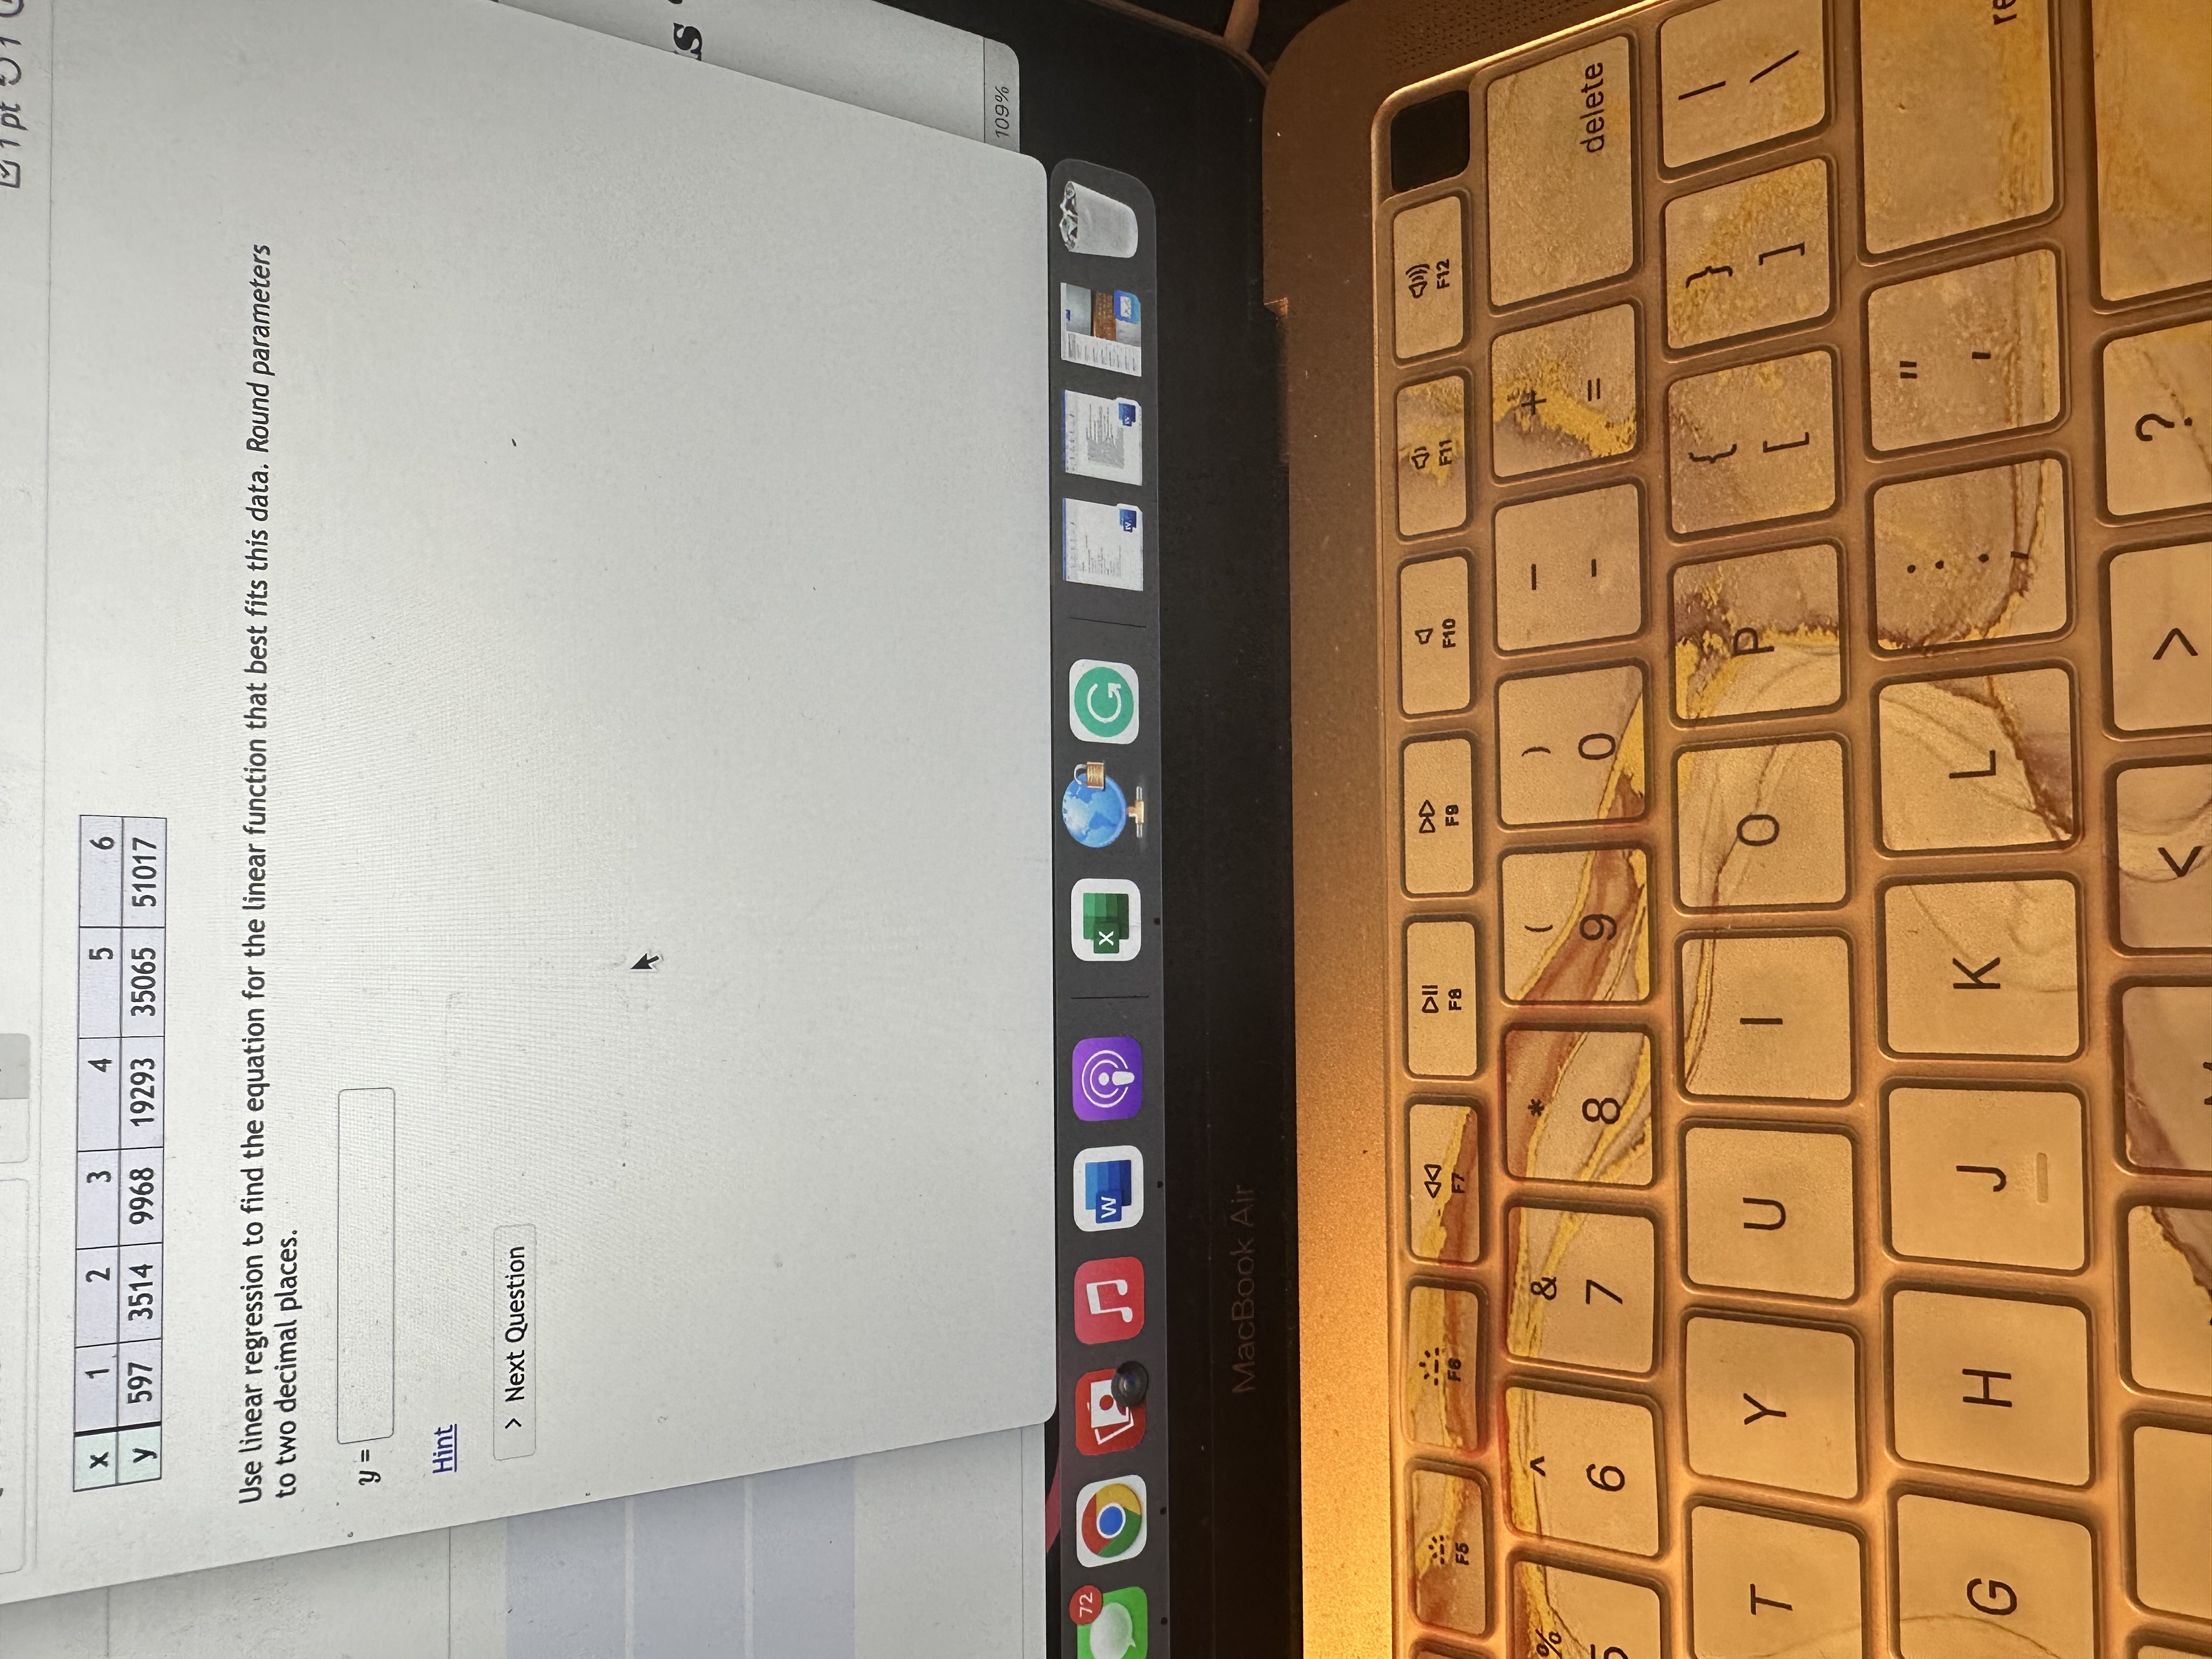
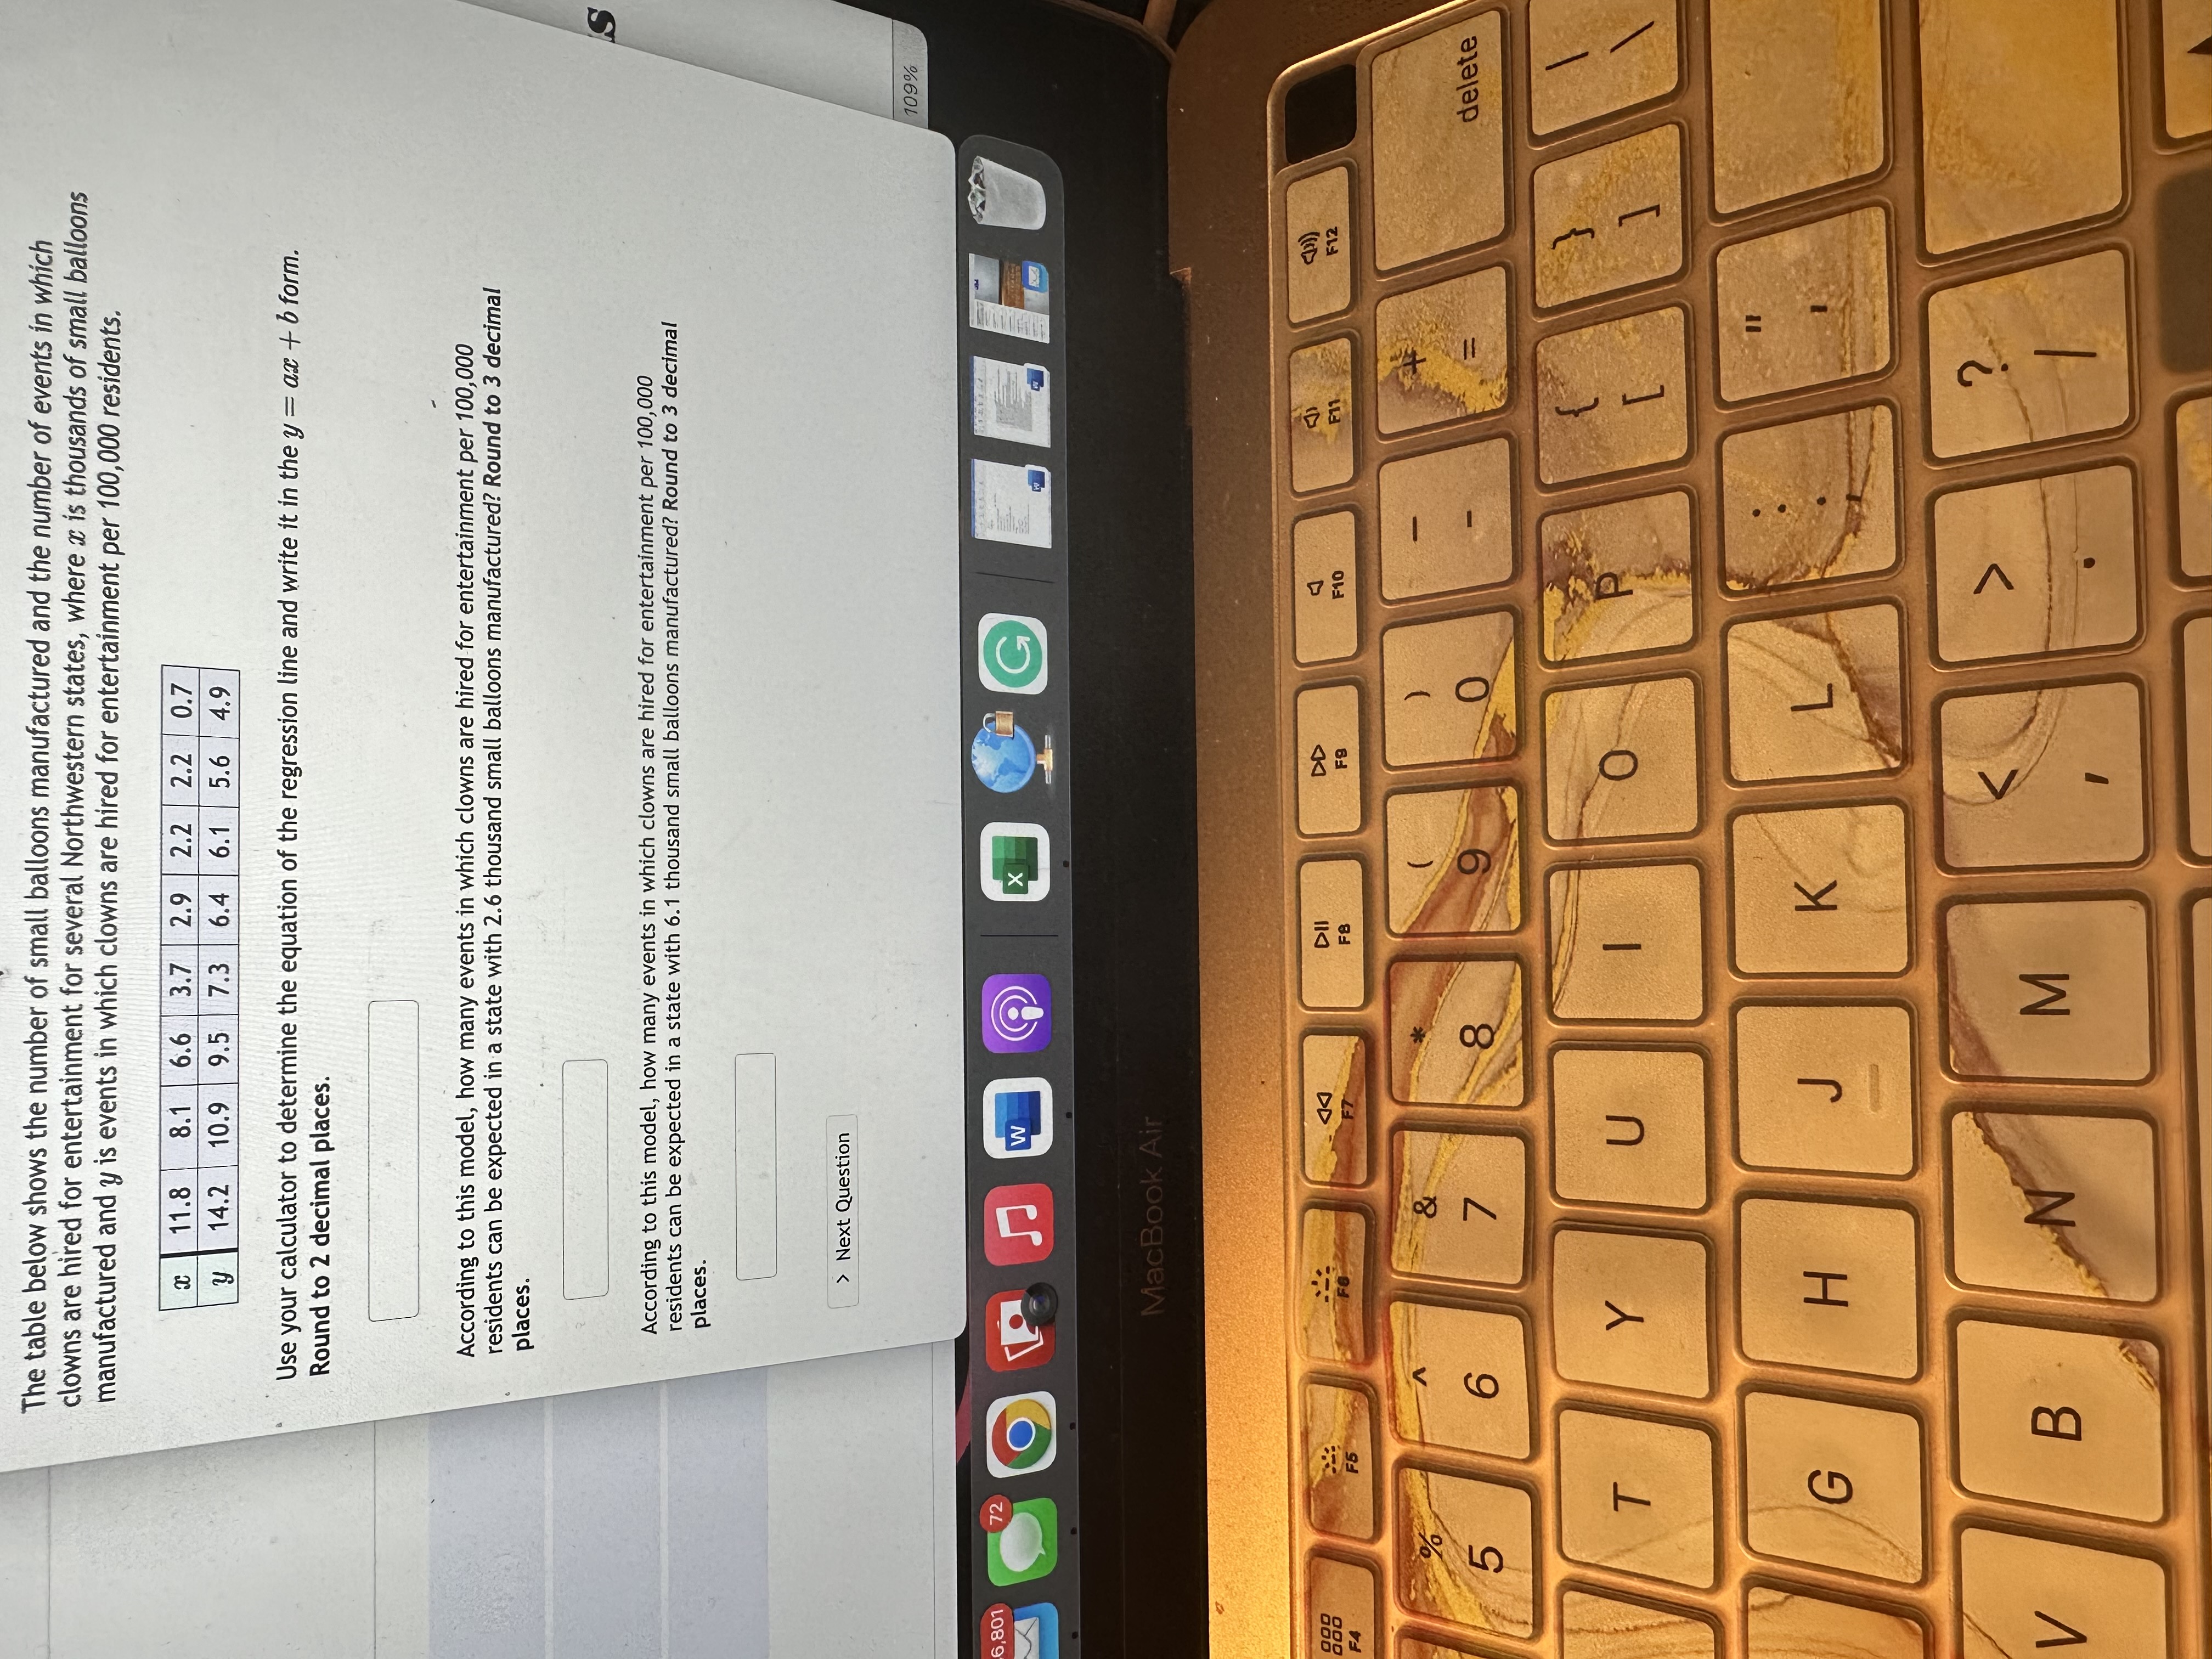
. Question 11 Find the mean for this list of numbers 56 37 40 96 57 74 23 17 72 95 10 62 39 82 48 Mean = > Next Question W G MacBook Air DII DD F8 F10 F11 F12 FB F7 F9 6 8 O0/ ZU answered .Question 12 The table below shows the scores of a group of students on a 10-point quiz. Test Score Frequency 4 4 5 5 6 O 7 2 8 3 5 10 4 The mean score on this test is: The median score on this test is: >Next Question 72 w G MacBook Air DII DD F11 F12 F6 F7 F8 F10 F6 F8 CO V 8ZO points possible 0/ 20 answered .Question 13 Find the mode for this list of numbers 73 12 36 53 12 46 -1 43 53 53 38 32 Mode = > Next Question 72 W G MacBook Air DII DD F10 F11 F12 F6 F6 F7 FB Fg O 820 points possible 0/20 answered .Question 14 Find the range for this list of numbers 32 7 17 78 98 31 76 53 63 4 90 94 16 55 37 Range = Next Question 72 W MacBook Air DII DD (ID F6 FO F7 F8 F8 F10 F11 F12 & 8 Ogress saved 20 points possible 0/20 answered .Question 15 A sample was done, collecting the data below. Calculate the standard deviation, to one decimal place. X 21 12 11 13 > Next Question 72 W G MacBook Air 4 DII DD F6 F6 F8 F9 F10 F11 F12 F7 & 8Question 16 [ 1 pt ive yo lution The highway mileage (mpg) for a sample of 8 different models of a car company can be found below. Find the 5-number summary and use it to create a boxplot. 17, 21, 23, 27, 30, 32, 36, 36 O 17 18 19 20 21 22 23 24 25 26 27 28 29 30 31 32 33 34 35 36 mpg O 17 18 19 20 21 22 23 24 25 26 27 28 29 30 31 32 33 34 35 36 mpg 17 18 19 20 21 22 23 24 25 26 27 28 29 30 31 32 33 34 35 36 mpg Q 17 18 19 20 21 22 23 24 25 26 27 28 29 30 31 32 33 34 35 36 mps Q O 17 18 19 20 21 22 23 24 25 26 27 28 29 30 31 32 33 34 35 36 mpg Next Question 109% 72 W X MacBook Air 44 DII DD FB F10 F11 F12 F6 F7 8 O del 6 T Y U 050m Match each scatterplot shown below with one of the four specified correlation coefficients. a. 0.31 Receive yo solution b. -0.30 C. 0.60 O d. -0.98 - - O- O O O OC DO - V- O S "F C - -+ O O O 109% - v to + 46,801 72 W MacBook Air DD F11 F12 EA F6 F7 & O 7 8 9 delete 6 T Y U O G H C K L1 pt X 1 2 3 4 5 6 y 597 3514 9968 19293 35065 51017 Use linear regression to find the equation for the linear function that best fits this data. Round parameters to two decimal places. y = Hint > Next Question IS 109% 72 O W MacBook Air DII DD F5 F6 F7 F8 Fg F10 F11 F12 & 6 7 8 9 delete T Y U G H C K L > ?The table below shows the number of small balloons manufactured and the number of events in which clowns are hired for entertainment for several Northwestern states, where a is thousands of small balloons manufactured and y is events in which clowns are hired for entertainment per 100,000 residents. a 11.8 8.1 6.6 3.7 2.9 2.2 2.2 0.7 y 14.2 10.9 9.5 7.3 6.4 6.1 5.6 4.9 Use your calculator to determine the equation of the regression line and write it in the y = ax + b form. Round to 2 decimal places. According to this model, how many events in which clowns are hired for entertainment per 100,000 residents can be expected in a state with 2.6 thousand small balloons manufactured? Round to 3 decimal places. According to this model, how many events in which clowns are hired for entertainment per 100,000 residents can be expected in a state with 6.1 thousand small balloons manufactured? Round to 3 decimal places. > Next Question 109% 6,801 72 O W G MacBook Air DII DD FB F10 F12 FA F7 F9 F11 F6 & 6 7 8 9 0 = delete 5 T Y U O G H K L
Step by Step Solution
There are 3 Steps involved in it
Step: 1
Get Instant Access to Expert-Tailored Solutions
See step-by-step solutions with expert insights and AI powered tools for academic success
Step: 2
Step: 3
Ace Your Homework with AI
Get the answers you need in no time with our AI-driven, step-by-step assistance