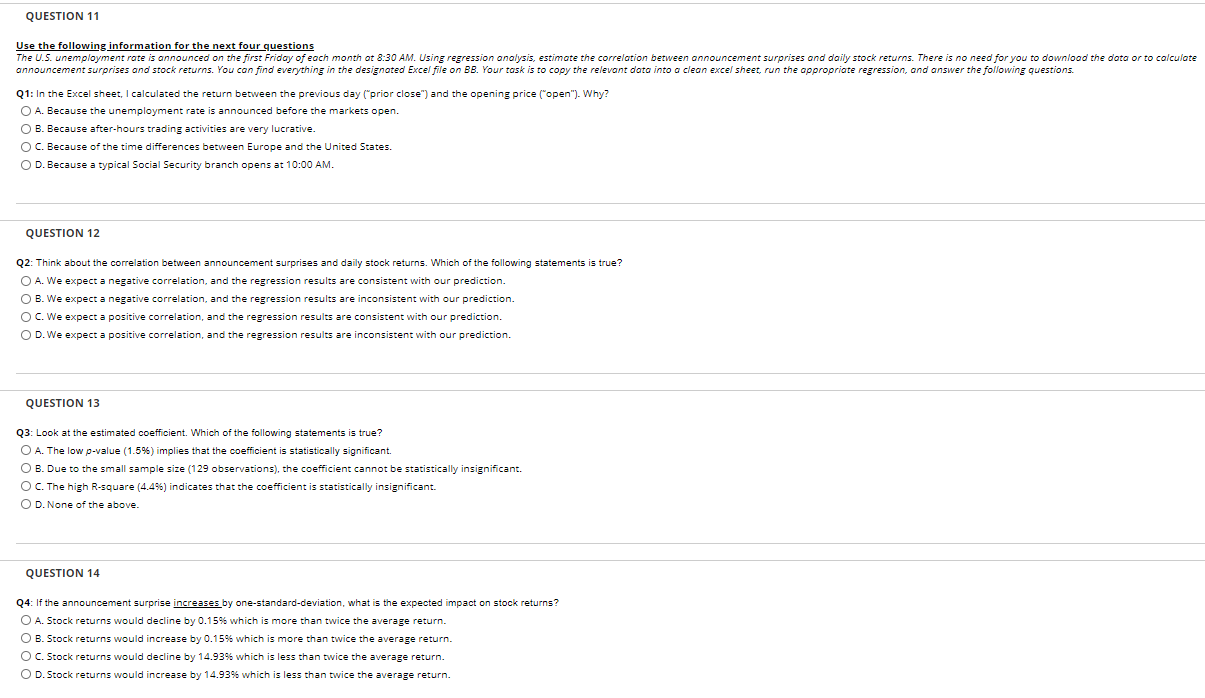
QUESTION 11 Use the following information for the next four questions The U.S. unemployment rate is announced on the first Friday of each month at 8:30 AM. Using regression analysis, estimate the correlation between announcement surprises and daily stock returns. There is no need for you to download the data or to calculate announcement surprises and stock returns. You can find everything in the designated Excel file on BB. Your task is to copy the relevant data into a clean excel sheet, run the appropriate regression, and answer the following questions. Q1: In the Excel sheet, I calculated the return between the previous day ("prior close") and the opening price ("open"). Why? O A. Because the unemployment rate is announced before the markets open. B. Because after-hours trading activities are very lucrative. O C. Because of the time differences between Europe and the United States. O D. Because a typical Social Security branch opens at 10:00 AM. QUESTION 12 Q2: Think about the correlation between announcement surprises and daily stock returns. Which of the following statements is true? O A. We expect a negative correlation, and the regression results are consistent with our prediction. O B. We expect a negative correlation, and the regression results are inconsistent with our prediction. OC. We expect a positive correlation, and the regression results are consistent with our prediction. OD.We expect a positive correlation, and the regression results are inconsistent with our prediction. QUESTION 13 Q3: Look at the estimated coefficient. Which of the following statements is true? O A. The low p-value (1.5%) implies that the coefficient is statistically significant. O B. Due to the small sample size (129 observations), the coefficient cannot be statistically insignificant. O C. The high R-square (4.496) indicates that the coefficient is statistically insignificant. O D. None of the above. QUESTION 14 Q4: If the announcement surprise increases by one-standard deviation, what is the expected impact on stock returns? O A. Stock returns would decline by 0.15% which is more than twice the average return. O B. Stock returns would increase by 0.15% which is more than twice the average return. O C. Stock returns would decline by 14.939 which is less than twice the average return. O D. Stock returns would increase by 14.9396 which is less than twice the average return. QUESTION 11 Use the following information for the next four questions The U.S. unemployment rate is announced on the first Friday of each month at 8:30 AM. Using regression analysis, estimate the correlation between announcement surprises and daily stock returns. There is no need for you to download the data or to calculate announcement surprises and stock returns. You can find everything in the designated Excel file on BB. Your task is to copy the relevant data into a clean excel sheet, run the appropriate regression, and answer the following questions. Q1: In the Excel sheet, I calculated the return between the previous day ("prior close") and the opening price ("open"). Why? O A. Because the unemployment rate is announced before the markets open. B. Because after-hours trading activities are very lucrative. O C. Because of the time differences between Europe and the United States. O D. Because a typical Social Security branch opens at 10:00 AM. QUESTION 12 Q2: Think about the correlation between announcement surprises and daily stock returns. Which of the following statements is true? O A. We expect a negative correlation, and the regression results are consistent with our prediction. O B. We expect a negative correlation, and the regression results are inconsistent with our prediction. OC. We expect a positive correlation, and the regression results are consistent with our prediction. OD.We expect a positive correlation, and the regression results are inconsistent with our prediction. QUESTION 13 Q3: Look at the estimated coefficient. Which of the following statements is true? O A. The low p-value (1.5%) implies that the coefficient is statistically significant. O B. Due to the small sample size (129 observations), the coefficient cannot be statistically insignificant. O C. The high R-square (4.496) indicates that the coefficient is statistically insignificant. O D. None of the above. QUESTION 14 Q4: If the announcement surprise increases by one-standard deviation, what is the expected impact on stock returns? O A. Stock returns would decline by 0.15% which is more than twice the average return. O B. Stock returns would increase by 0.15% which is more than twice the average return. O C. Stock returns would decline by 14.939 which is less than twice the average return. O D. Stock returns would increase by 14.9396 which is less than twice the average return


