

Answered step by step
Verified Expert Solution
Question
1 Approved Answer
Question 12 (20 marks) You will be able to answer parts (a) and (b) of this question after you have studied Week 7. The rest
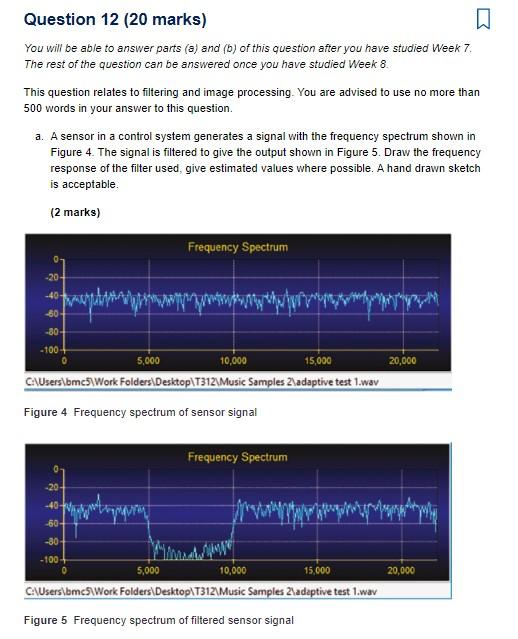
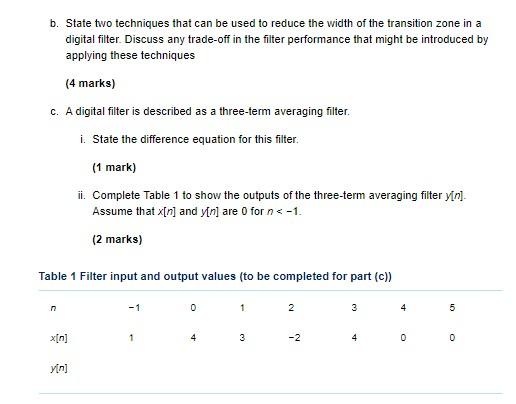
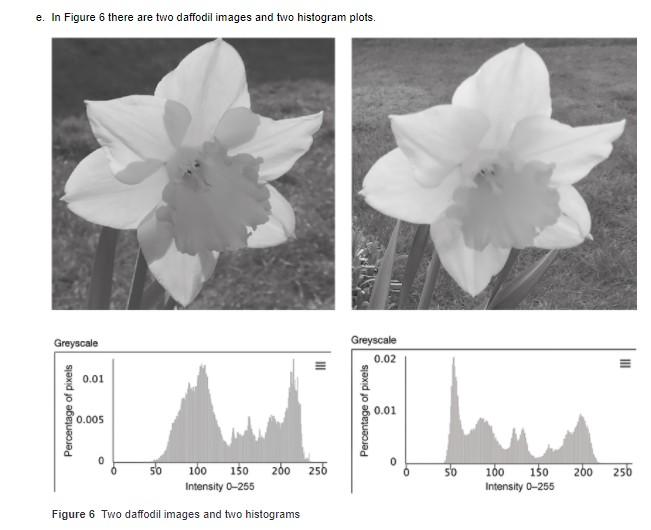
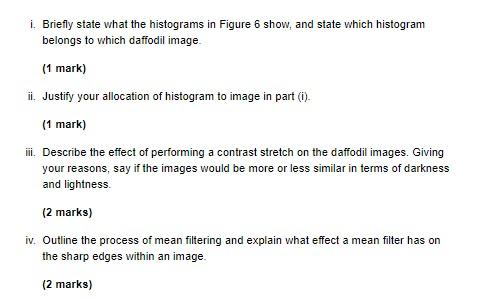
Question 12 (20 marks) You will be able to answer parts (a) and (b) of this question after you have studied Week 7. The rest of the question can be answered once you have studied Week 8. This question relates to filtering and image processing. You are advised to use no more than 500 words in your answer to this question. a. A sensor in a control system generates a signal with the frequency spectrum shown in Figure 4. The signal is filtered to give the output shown in Figure 5. Draw the frequency response of the filter used, give estimated values where possible. A hand drawn sketch is acceptable. (2 marks) Frequency Spectrum -2014 -40- -60 -80- 20,000 -1004 5,000 10,000 15,000 C:\Users\bmc5) Work Folders\Desktop\T312\Music Samples 2\adaptive test 1.wav Figure 4 Frequency spectrum of sensor signal Frequency Spectrum 20 -40 Ayam 604 -801 -100 5,000 15,000 20,000 10,000 C:Users\bmcs\Work Folders\Desktop\T312\Music Samples 2 adaptive test 1.wav Figure 5 Frequency spectrum of filtered sensor signal b. State two techniques that can be used to reduce the width of the transition zone in a digital filter. Discuss any trade-off in the filter performance that might be introduced by applying these techniques (4 marks) C. A digital filter is described as a three-term averaging filter. i. State the difference equation for this filter. (1 mark) ii. Complete Table 1 to show the outputs of the three-term averaging filter yin). Assume that x[n] and y[n] are o for n 5 and discuss any difference between the output of n > 5 compared with that of the filter in part (c). (3 marks) Table 2 Filter input and output values to be completed for part (c)) -1 0 1 2 3 4 5 xin) 1 4 3 -2 0 vin) e. In Figure 6 there are two daffodil images and two histogram plots. Greyscale Greyscale 0.02 0.01 0.01 0.005 200 256 50 100 150 Intensity 0-255 200 256 100 150 Intensity O-256 Figure 6 Two daffodil images and two histograms 1. Briefly state what the histograms in Figure 6 show, and state which histogram belongs to which daffodil image (1 mark) ii. Justify your allocation of histogram to image in parti). (1 mark) ii. Describe the effect of performing a contrast stretch on the daffodil images. Giving your reasons, say if the images would be more or less similar in terms of darkness and lightness. (2 marks) iv. Outline the process of mean filtering and explain what effect a mean filter has on the sharp edges within an image (2 marks) Question 12 (20 marks) You will be able to answer parts (a) and (b) of this question after you have studied Week 7. The rest of the question can be answered once you have studied Week 8. This question relates to filtering and image processing. You are advised to use no more than 500 words in your answer to this question. a. A sensor in a control system generates a signal with the frequency spectrum shown in Figure 4. The signal is filtered to give the output shown in Figure 5. Draw the frequency response of the filter used, give estimated values where possible. A hand drawn sketch is acceptable. (2 marks) Frequency Spectrum -2014 -40- -60 -80- 20,000 -1004 5,000 10,000 15,000 C:\Users\bmc5) Work Folders\Desktop\T312\Music Samples 2\adaptive test 1.wav Figure 4 Frequency spectrum of sensor signal Frequency Spectrum 20 -40 Ayam 604 -801 -100 5,000 15,000 20,000 10,000 C:Users\bmcs\Work Folders\Desktop\T312\Music Samples 2 adaptive test 1.wav Figure 5 Frequency spectrum of filtered sensor signal b. State two techniques that can be used to reduce the width of the transition zone in a digital filter. Discuss any trade-off in the filter performance that might be introduced by applying these techniques (4 marks) C. A digital filter is described as a three-term averaging filter. i. State the difference equation for this filter. (1 mark) ii. Complete Table 1 to show the outputs of the three-term averaging filter yin). Assume that x[n] and y[n] are o for n 5 and discuss any difference between the output of n > 5 compared with that of the filter in part (c). (3 marks) Table 2 Filter input and output values to be completed for part (c)) -1 0 1 2 3 4 5 xin) 1 4 3 -2 0 vin) e. In Figure 6 there are two daffodil images and two histogram plots. Greyscale Greyscale 0.02 0.01 0.01 0.005 200 256 50 100 150 Intensity 0-255 200 256 100 150 Intensity O-256 Figure 6 Two daffodil images and two histograms 1. Briefly state what the histograms in Figure 6 show, and state which histogram belongs to which daffodil image (1 mark) ii. Justify your allocation of histogram to image in parti). (1 mark) ii. Describe the effect of performing a contrast stretch on the daffodil images. Giving your reasons, say if the images would be more or less similar in terms of darkness and lightness. (2 marks) iv. Outline the process of mean filtering and explain what effect a mean filter has on the sharp edges within an image (2 marks)
Step by Step Solution
There are 3 Steps involved in it
Step: 1

Get Instant Access to Expert-Tailored Solutions
See step-by-step solutions with expert insights and AI powered tools for academic success
Step: 2

Step: 3
Ace Your Homework with AI
Get the answers you need in no time with our AI-driven, step-by-step assistance
Get Started
College Accounting Chapters 1-29
Authors: John J. Wild, Vernon J. Richardson, Ken W. Shaw
2nd Edition
0077398173, 978-0077398170