

Answered step by step
Verified Expert Solution
Question
1 Approved Answer
question 12 please 12. Copy the formula in cell 115 and then paste only the formula in the range 116:123. 13. Change the chart in
question 12 please 
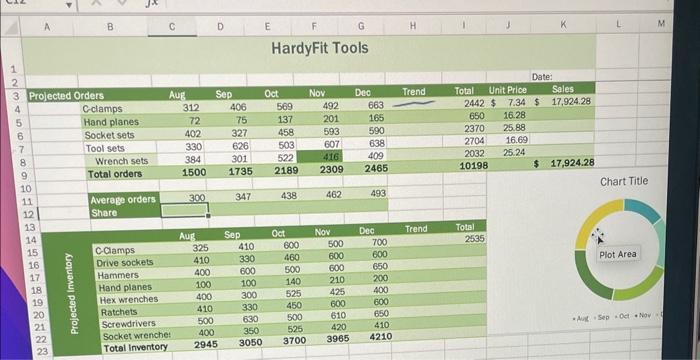
12. Copy the formula in cell 115 and then paste only the formula in the range 116:123. 13. Change the chart in the range 310:O23 to a Pie chart. Enter Average Orders per Month as the chart title. Add data labels to the outside end of each slice. Your workbook should look like the Final Figures on the following pages. Save your changes, close the workbook, and then exit Excel. Follow the directions on the SAM website to submit your Step by Step Solution
There are 3 Steps involved in it
Step: 1

Get Instant Access to Expert-Tailored Solutions
See step-by-step solutions with expert insights and AI powered tools for academic success
Step: 2

Step: 3
Ace Your Homework with AI
Get the answers you need in no time with our AI-driven, step-by-step assistance
Get Started
The Manga Guide To Databases
Authors: Mana Takahashi, Shoko Azuma, Co Ltd Trend
1st Edition
1593271905, 978-1593271909