Answered step by step
Verified Expert Solution
Link Copied!

Question

1 Approved Answer

Question 13 Draw a scatter plot of the residuals for each line of best fit for Pick Number vs Career Length and for Pick Number
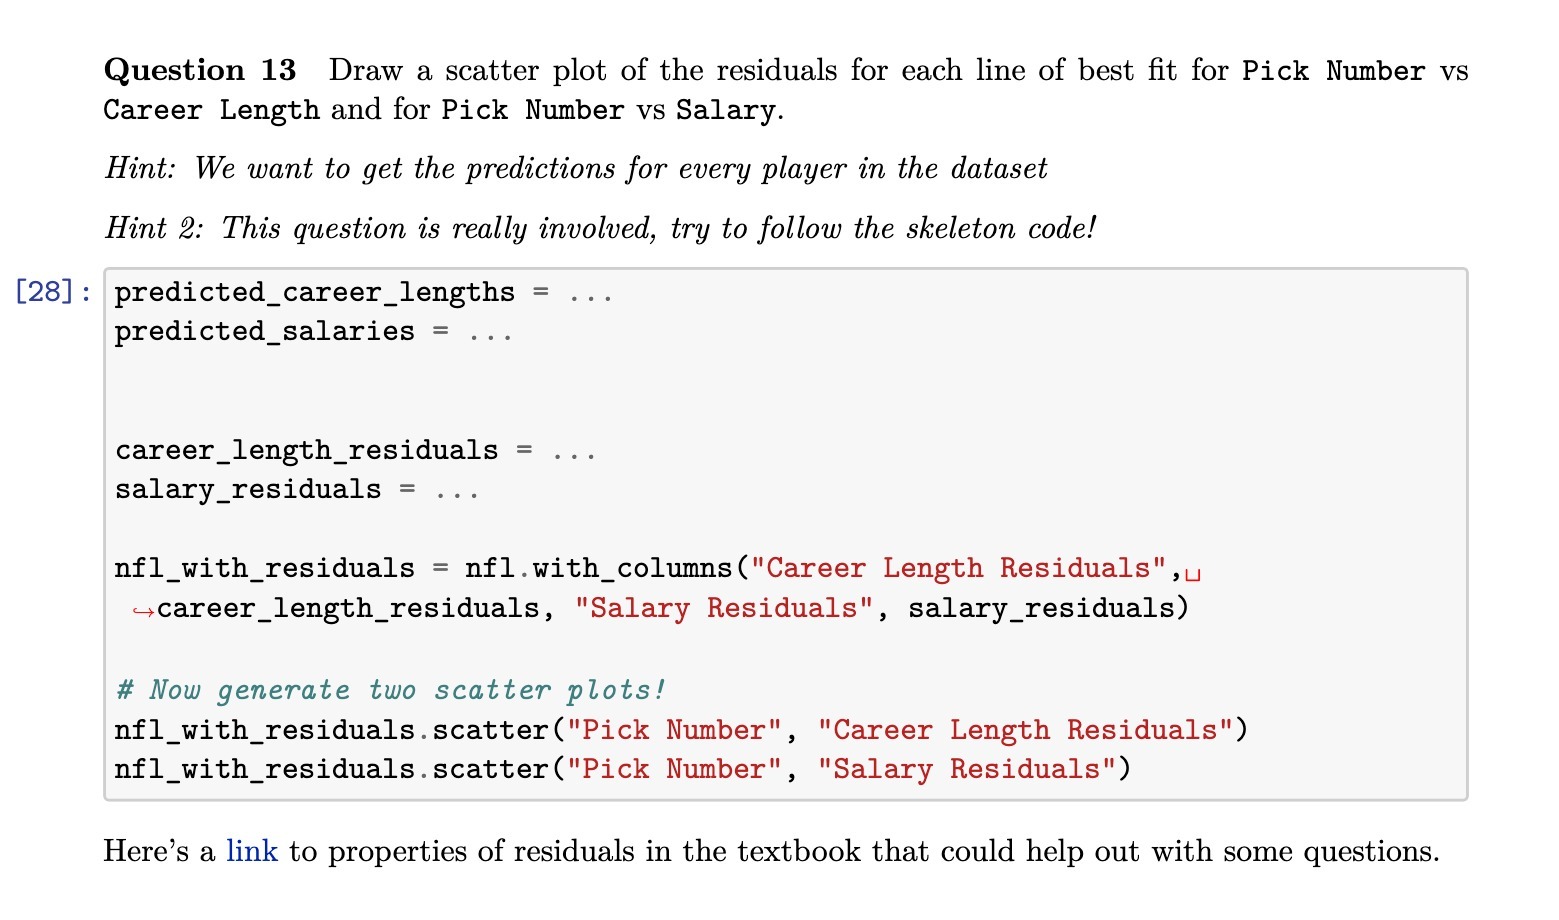
image text in transcribed
Question 13 Draw a scatter plot of the residuals for each line of best fit for Pick Number vs Career Length and for Pick Number vs Salary. Hint: We want to get the predictions for every player in the dataset Hint 2: This question is really involved, try to follow the skeleton code! [28] : predicted_career_lengths = ... predicted_salaries = . .. career_length_residuals = . .. salary_residuals = . .. nf1_with_residuals = nfl. with_columns ("Career Length Residuals", career_length_residuals, "Salary Residuals", salary_residuals) # Now generate two scatter plots! nf1_with_residuals . scatter ("Pick Number", "Career Length Residuals") nf1_with_residuals . scatter ("Pick Number", "Salary Residuals") Here's a link to properties of residuals in the textbook that could help out with some questions

Step by Step Solution

There are 3 Steps involved in it

Step: 1

blur-text-image

Get Instant Access to Expert-Tailored Solutions

See step-by-step solutions with expert insights and AI powered tools for academic success

Step: 2

blur-text-image

Step: 3

blur-text-image

Ace Your Homework with AI

Get the answers you need in no time with our AI-driven, step-by-step assistance

Get Started

Recommended Textbook for

Holt Mcdougal Larson Algebra 2

Authors: HOLT MCDOUGAL

1st Edition 2012

9780547647159, 0547647158

More Books

Students also viewed these Mathematics questions