Question 13: Please help with steps
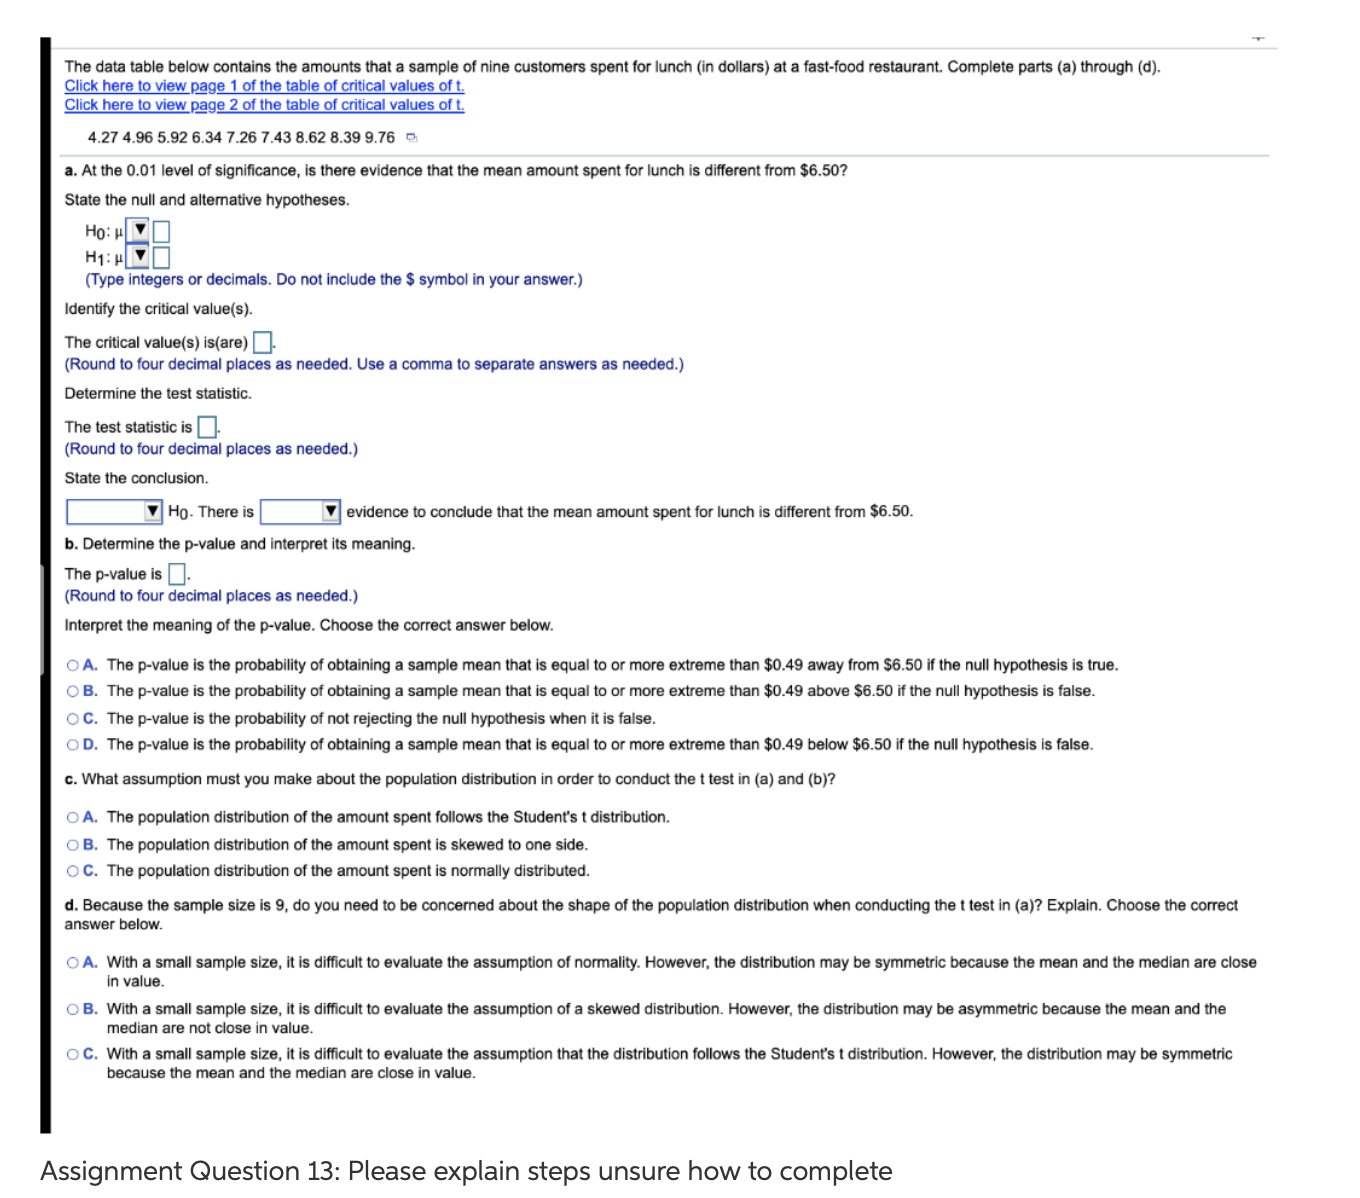
The data table below contains the amounts that a sample of nine customers spent for lunch (in dollars) at a fast-food restaurant. Complete parts (a) through (d). Click here to view page 1 of the table of critical values of t. Click here to view page 2 of the table of critical values of t. 4.27 4.96 5.92 6.34 7.26 7.43 8.62 8.39 9.76 - a. At the 0.01 level of significance, is there evidence that the mean amount spent for lunch is different from $6.50? State the null and alternative hypotheses. Ho: HVO H1: 1 0 Type integers or decimals. Do not include the $ symbol in your answer.) Identify the critical value(s). The critical value(s) is(are). (Round to four decimal places as needed. Use a comma to separate answers as needed.) Determine the test statistic. The test statistic is (Round to four decimal places as needed.) State the conclusion. Ho- There is evidence to conclude that the mean amount spent for lunch is different from $6.50. b. Determine the p-value and interpret its meaning. The p-value is. (Round to four decimal places as needed.) Interpret the meaning of the p-value. Choose the correct answer below. O A. The p-value is the probability of obtaining a sample mean that is equal to or more extreme than $0.49 away from $6.50 if the null hypothesis is true. O B. The p-value is the probability of obtaining a sample mean that is equal to or more extreme than $0.49 above $6.50 if the null hypothesis is false. O C. The p-value is the probability of not rejecting the null hypothesis when it is false. O D. The p-value is the probability of obtaining a sample mean that is equal to or more extreme than $0.49 below $6.50 if the null hypothesis is false. c. What assumption must you make about the population distribution in order to conduct the t test in (a) and (b)? O A. The population distribution of the amount spent follows the Student's t distribution. O B. The population distribution of the amount spent is skewed to one side. O C. The population distribution of the amount spent is normally distributed. d. Because the sample size is 9, do you need to be concerned about the shape of the population distribution when conducting the t test in (a)? Explain. Choose the correct answer below. O A. With a small sample size, it is difficult to evaluate the assumption of normality. However, the distribution may be symmetric because the mean and the median are close in value O B. With a small sample size, it is difficult to evaluate the assumption of a skewed distribution. However, the distribution may be asymmetric because the mean and the median are not close in value. O C. With a small sample size, it is difficult to evaluate the assumption that the distribution follows the Student's t distribution. However, the distribution may be symmetric because the mean and the median are close in value. Assignment Question 13: Please explain steps unsure how to complete


