Answered step by step
Verified Expert Solution
Question
1 Approved Answer
QUESTION 14 We have a sample of 6 subjects from a population. Calculate the sample standard deviation and estimated standard error of the mean


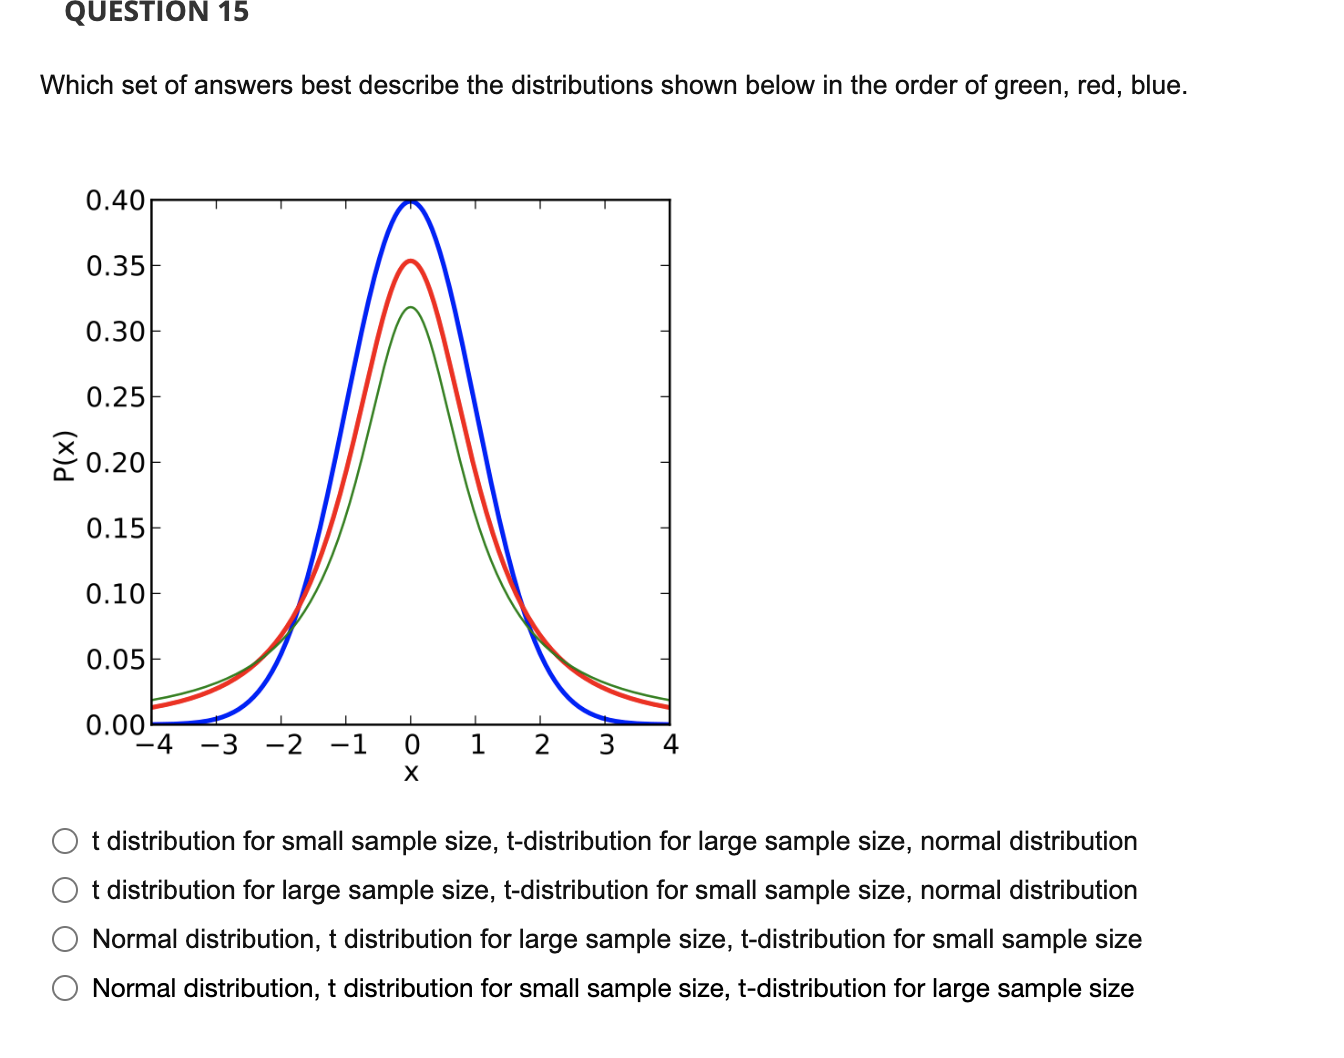
QUESTION 14 We have a sample of 6 subjects from a population. Calculate the sample standard deviation and estimated standard error of the mean for the population. The scores are 7, 1, 6, 3, 6, 7 6,1 6, 2.45 2.45, 1 30,6 P(x) QUESTION 15 Which set of answers best describe the distributions shown below in the order of green, red, blue. 0.40 0.35 0.30 0.25 0.20 0.15 0.10 0.05 0.00 4 -3 -2 -1 0 1 2 3 4 X t distribution for small sample size, t-distribution for large sample size, normal distribution t distribution for large sample size, t-distribution for small sample size, normal distribution Normal distribution, t distribution for large sample size, t-distribution for small sample size Normal distribution, t distribution for small sample size, t-distribution for large sample size
Step by Step Solution
There are 3 Steps involved in it
Step: 1

Get Instant Access to Expert-Tailored Solutions
See step-by-step solutions with expert insights and AI powered tools for academic success
Step: 2

Step: 3

Ace Your Homework with AI
Get the answers you need in no time with our AI-driven, step-by-step assistance
Get Started


