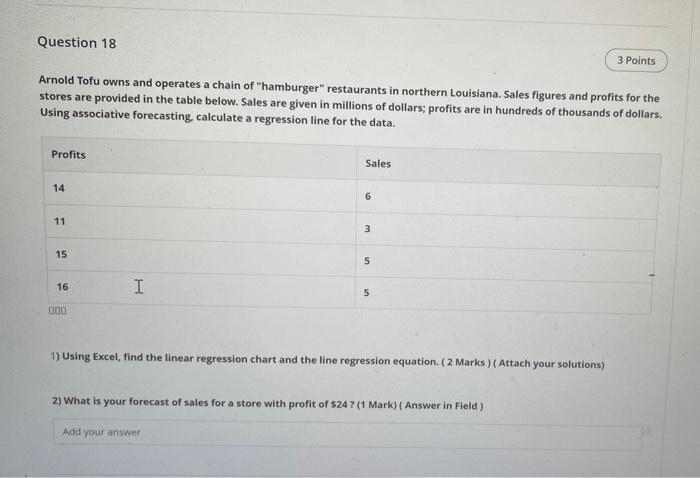
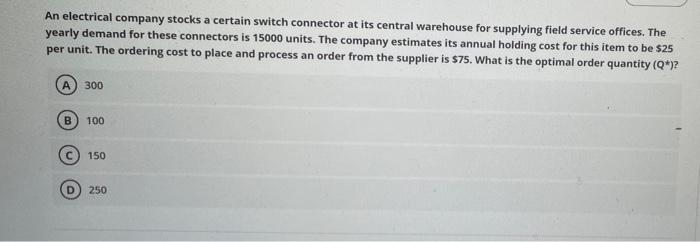
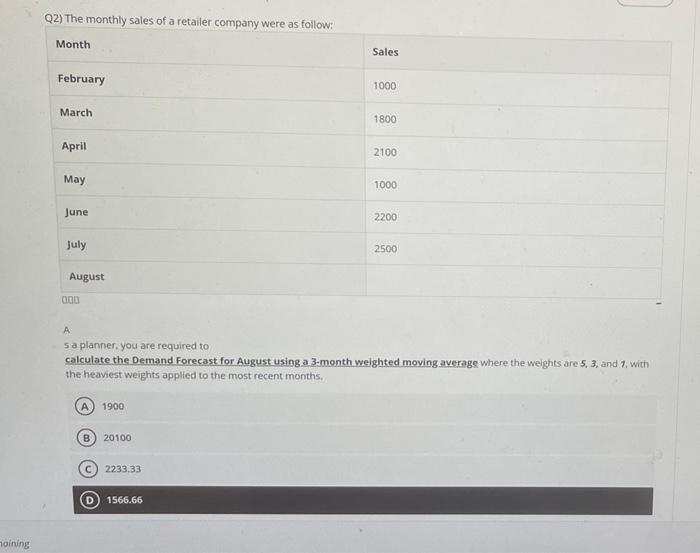
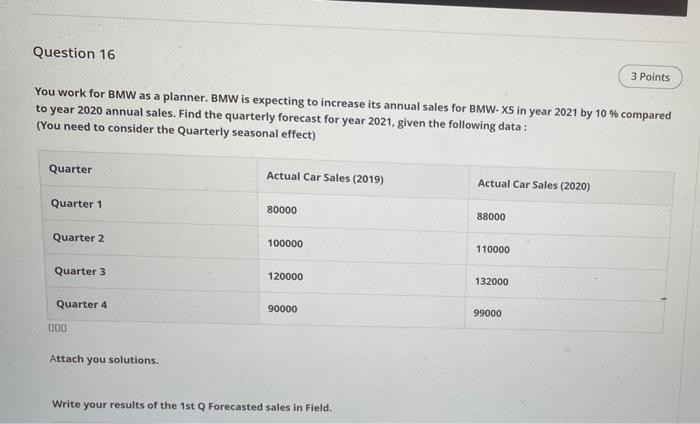
Question 18 3 Points Arnold Tofu owns and operates a chain of "hamburger restaurants in northern Louisiana. Sales figures and profits for the stores are provided in the table below. Sales are given in millions of dollars; profits are in hundreds of thousands of dollars. Using associative forecasting calculate a regression line for the data. Profits Sales 14 6 11 3 15 5 16 I 5 000 1) Using Excel, find the linear regression chart and the line regression equation. ( 2 Marks) (Attach your solutions) 2) What is your forecast of sales for a store with profit of $24 ? (1 Mark) ( Answer in Field) Add your answer An electrical company stocks a certain switch connector at its central warehouse for supplying field service offices. The yearly demand for these connectors is 15000 units. The company estimates its annual holding cost for this item to be $25 per unit. The ordering cost to place and process an order from the supplier is $75. What is the optimal order quantity (Q*)? A 300 100 150 D 250 Q2) The monthly sales of a retailer company were as follow: Month Sales February 1000 March 1800 April 2100 May 1000 June 2200 July 2500 August 000 sa planner, you are required to calculate the Demand Forecast for August using a 3-month weighted moving average where the weights are 5, 3, and 1. with the heaviest weights applied to the most recent months 1900 B 20100 2233.33 1566.66 hoining Question 16 3 Points You work for BMW as a planner. BMW is expecting to increase its annual sales for BMW-XS in year 2021 by 10 % compared to year 2020 annual sales. Find the quarterly forecast for year 2021. given the following data: (You need to consider the Quarterly seasonal effect) Quarter Actual Car Sales (2019) Actual Car Sales (2020) Quarter 1 80000 88000 Quarter 2 100000 110000 Quarter 3 120000 132000 Quarter 4 90000 99000 000 Attach you solutions. Write your results of the 1st Q Forecasted sales in Field