

Answered step by step
Verified Expert Solution
Question
1 Approved Answer
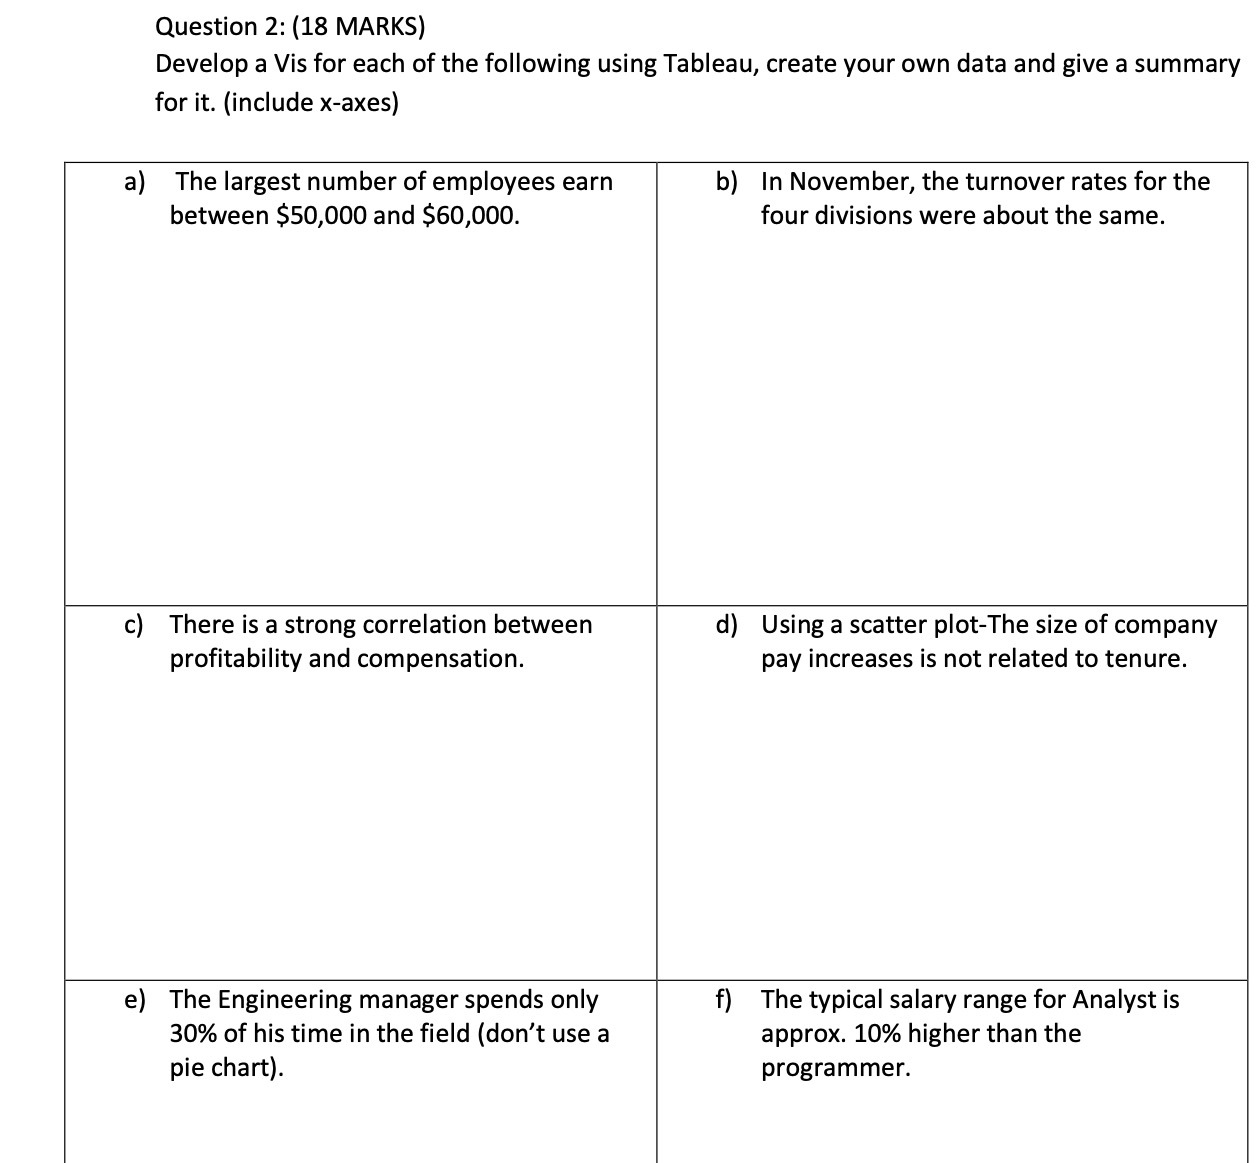
Question 2: (18 MARKS} Develop a Vis for each of the following using Tableau, create your own data and give a summary for it. (include
Step by Step Solution
There are 3 Steps involved in it
Step: 1

Get Instant Access to Expert-Tailored Solutions
See step-by-step solutions with expert insights and AI powered tools for academic success
Step: 2

Step: 3
Ace Your Homework with AI
Get the answers you need in no time with our AI-driven, step-by-step assistance
Get Started
Graph Colouring And Applications
Authors: Pierre Hansen ,Odile Marcotte
1st Edition
0821819550, 978-0821819555