

Answered step by step
Verified Expert Solution
Question
1 Approved Answer
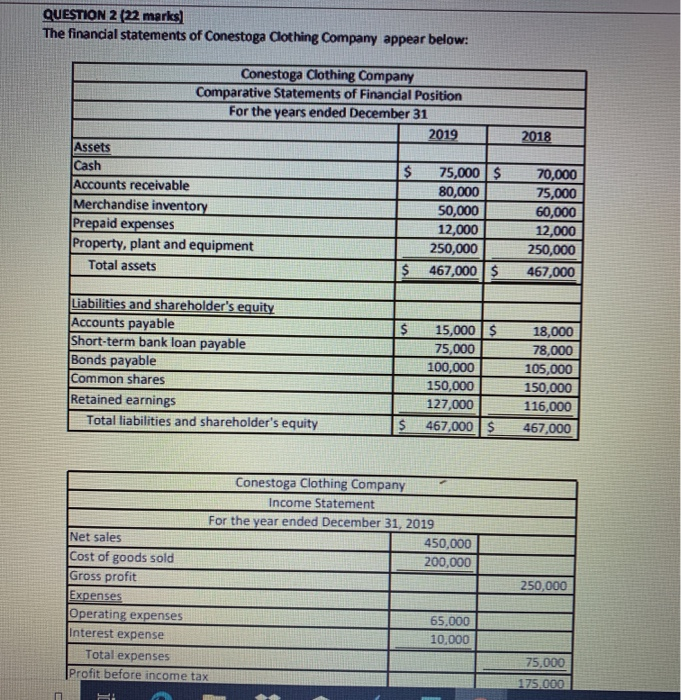
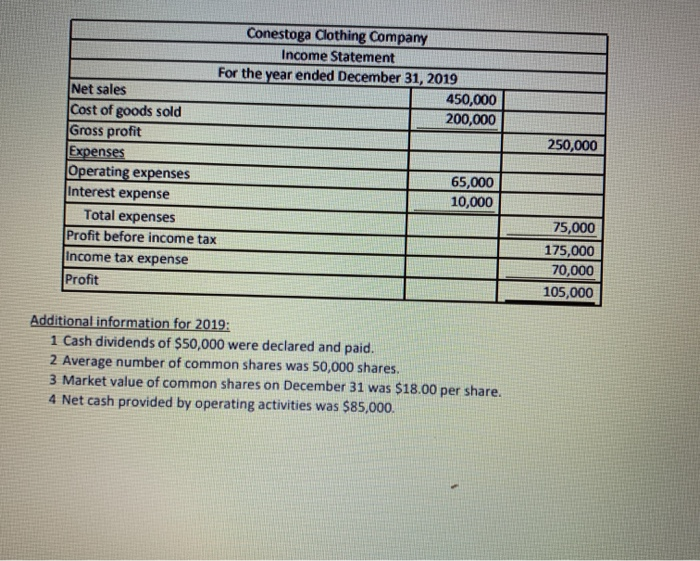
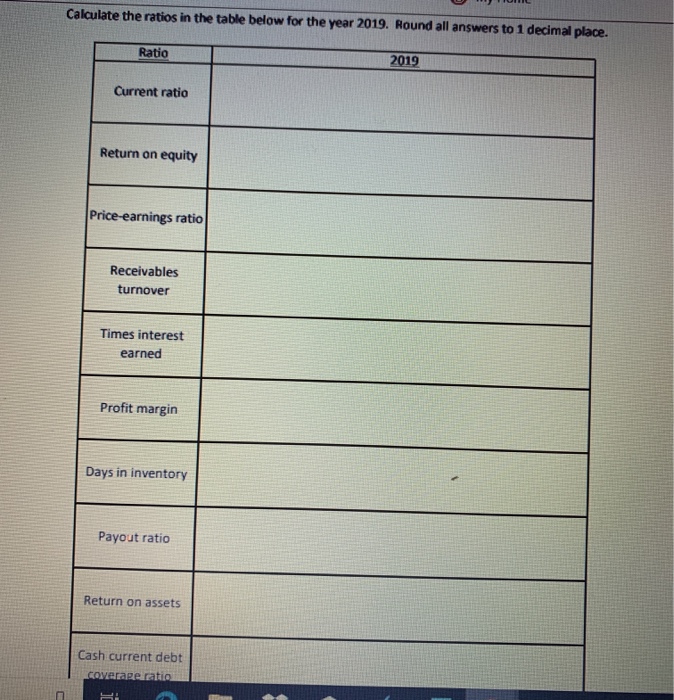
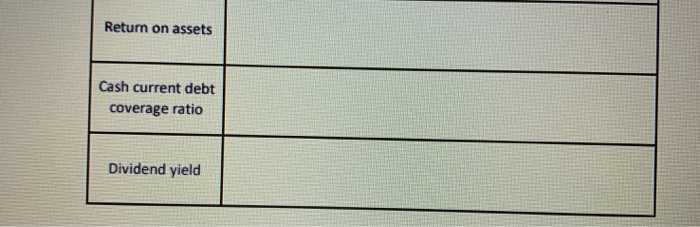
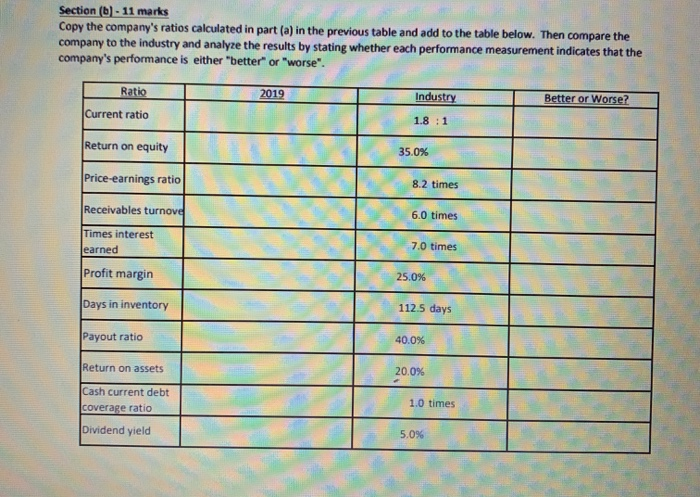
QUESTION 2 (22 marks) The financial statements of Conestoga Clothing Company appear below! Conestoga Clothing Company Comparative Statements of Financial Position For the years ended
Step by Step Solution
There are 3 Steps involved in it
Step: 1

Get Instant Access to Expert-Tailored Solutions
See step-by-step solutions with expert insights and AI powered tools for academic success
Step: 2

Step: 3
Ace Your Homework with AI
Get the answers you need in no time with our AI-driven, step-by-step assistance
Get Started
Care And Counsel For Combat Trauma Training Program Workbook For Audit Only
Authors: Cru Military, American Association Of Christian Counselors, Light University, Karen D Watkins
1st Edition
0986363081, 978-0986363085