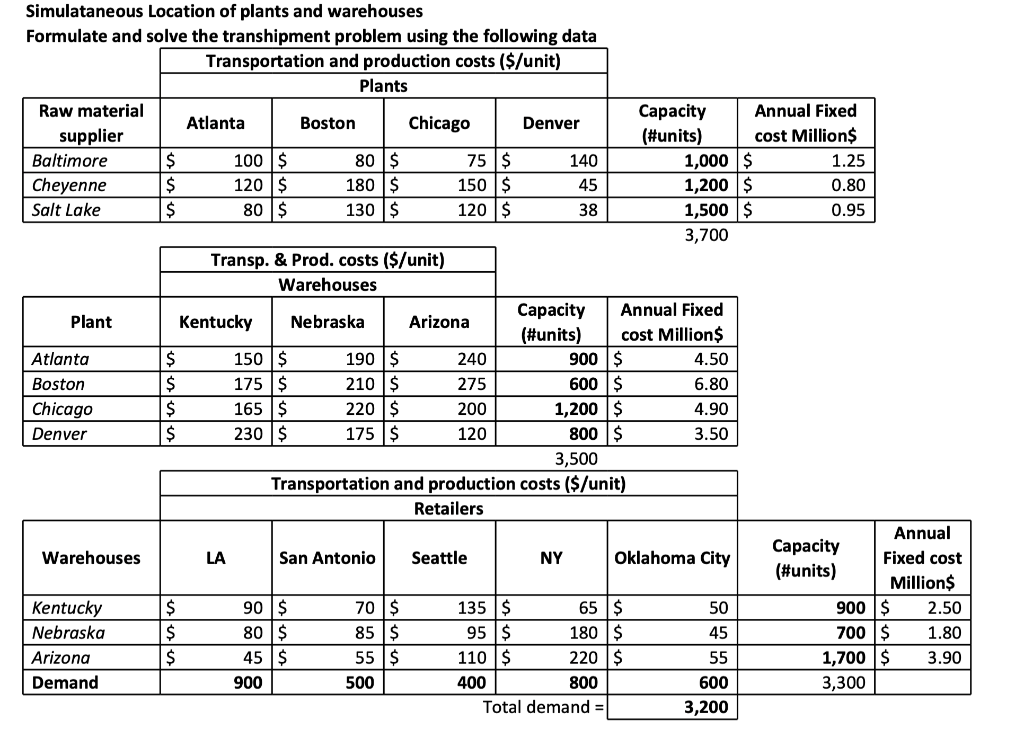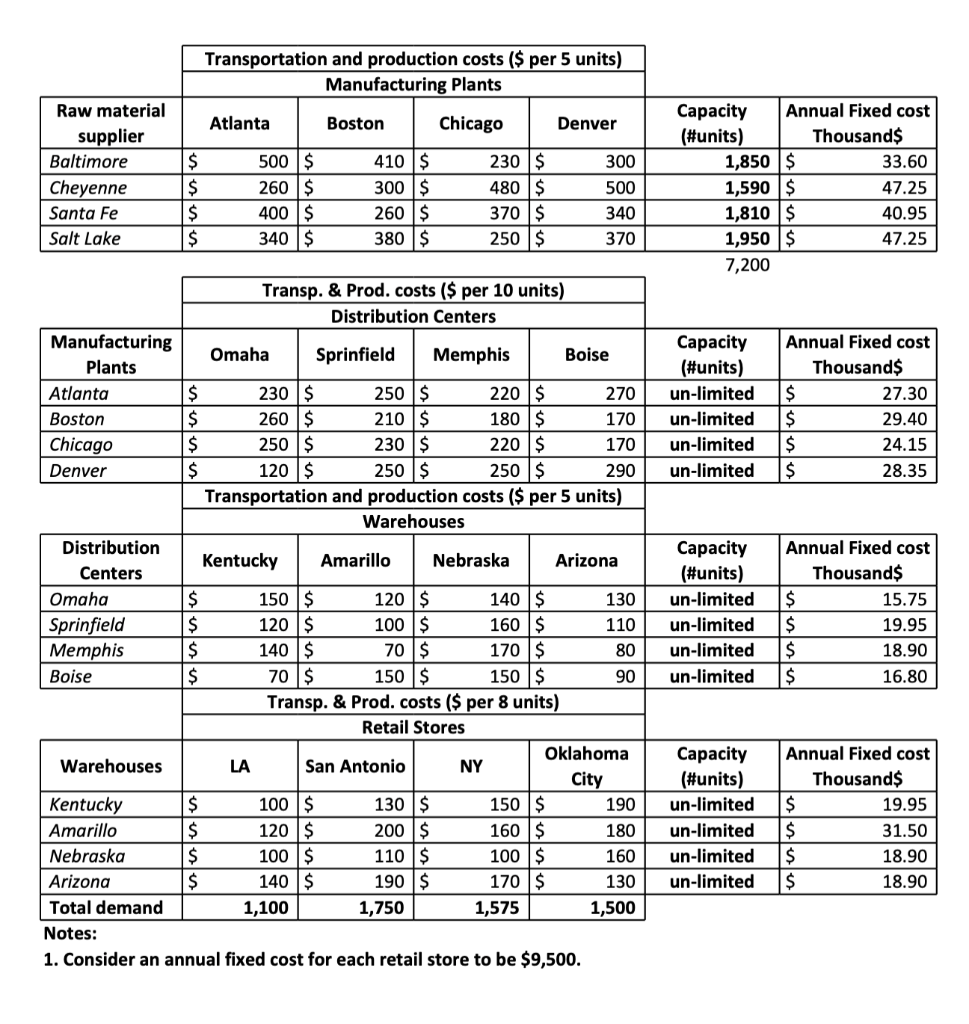


Question 2 25 pts With the information available at "example 5" sheet in this file facilities data.xlsx , provide the set of raw material suppliers to be opened (type the name with the first capital letters and separated by comma - do not use the word "and". Check your spelling since no credit will be given in case of a typo. Introduce the facilities in the same order as shown in the Excel file. For example: Atlanta, Boston, Denver) . Also, specify the warehouses that will operate in the optimal solution: Report the total transportation plus facility operation costs: Simulataneous Location of plants and warehouses Formulate and solve the transhipment problem using the following data Transportation and production costs ($/unit) Plants Raw material Capacity Annual Fixed Atlanta Boston Chicago Denver supplier (#units) cost Millions Baltimore $ 100 $ 80 $ 75$ 140 1,000 $ 1.25 Cheyenne $ 120 $ 180$ 150 $ 45 1,200 $ 0.80 Salt Lake $ 80 $ 130$ 120 $ 38 1,500 $ 0.95 3,700 Transp. & Prod. costs ($/unit) Warehouses Capacity Annual Fixed Plant Kentucky Nebraska Arizona (#units) cost Million $ Atlanta $ 150 $ 190 $ 240 900 S 4.50 Boston $ 175 $ 210 $ 275 600 $ 6.80 Chicago $ 165 $ 220$ 200 1,200 $ 4.90 Denver $ 230$ 175 $ 120 800 $ 3.50 3,500 Transportation and production costs ($/unit) Retailers Annual Capacity Warehouses LA San Antonio Seattle NY Oklahoma City Fixed cost (#units) Millions Kentucky $ 90 $ 70 $ 135$ 65 $ 50 900$ 2.50 Nebraska $ 80 $ 85$ 95$ 180 $ 45 700 $ 1.80 Arizona $ 45 $ 55 $ 110 $ 220 $ 55 1,700 $ 3.90 Demand 900 500 400 800 600 3,300 Total demand = 3,200 Transportation and production costs ($ per 5 units) Manufacturing Plants Atlanta Boston Chicago Denver Raw material supplier Baltimore Cheyenne Santa Fe Salt Lake $ $ $ $ 500 $ 260 $ 400 $ 340 $ 410 $ 300 $ 260 $ 380$ 230 $ 480 $ 370 $ 250 $ 300 500 340 370 Capacity Annual Fixed cost (#units) Thousands 1,850 $ 33.60 1,590$ 47.25 1,810 $ 40.95 1,950 $ 47.25 7,200 270 Capacity (#units) un-limited un-limited un-limited un-limited Annual Fixed cost Thousand $ $ 27.30 $ 29.40 $ 24.15 $ 28.35 Transp. & Prod. costs ($ per 10 units) Distribution Centers Manufacturing Omaha Sprinfield Memphis Boise Plants Atlanta $ 230$ 250 $ 220$ Boston $ 260 $ 210 $ 180 $ 170 Chicago $ 250 $ 230$ 220 $ 170 Denver $ 120$ 250 $ 250 $ 290 Transportation and production costs ($ per 5 units) Warehouses Distribution Kentucky Amarillo Nebraska Arizona Centers Omaha $ 150 $ 120 $ 140$ 130 Sprinfield $ 120 $ 100 $ 160 $ 110 Memphis $ 140 $ 70 $ 170$ 80 Boise $ 70 $ 150 $ 150 $ 90 Transp. & Prod. costs ($ per 8 units) Retail Stores Oklahoma Warehouses LA San Antonio NY City Kentucky $ 100 $ 130 $ 150 $ 190 Amarillo $ 120 $ 200 $ 160 $ 180 Nebraska $ 100 $ 110 $ 100 $ 160 Arizona $ 140 $ 190$ 170 $ 130 Total demand 1,100 1,750 1,575 1,500 Notes: 1. Consider an annual fixed cost for each retail store to be $9,500. Capacity (#units) un limited un-limited un-limited un limited Annual Fixed cost Thousands $ 15.75 $ 19.95 $ 18.90 $ 16.80 Capacity (#units) un-limited un-limited un-limited un-limited Annual Fixed cost Thousands $ 19.95 $ 31.50 $ 18.90 $ 18.90 Question 2 25 pts With the information available at "example 5" sheet in this file facilities data.xlsx , provide the set of raw material suppliers to be opened (type the name with the first capital letters and separated by comma - do not use the word "and". Check your spelling since no credit will be given in case of a typo. Introduce the facilities in the same order as shown in the Excel file. For example: Atlanta, Boston, Denver) . Also, specify the warehouses that will operate in the optimal solution: Report the total transportation plus facility operation costs: Simulataneous Location of plants and warehouses Formulate and solve the transhipment problem using the following data Transportation and production costs ($/unit) Plants Raw material Capacity Annual Fixed Atlanta Boston Chicago Denver supplier (#units) cost Millions Baltimore $ 100 $ 80 $ 75$ 140 1,000 $ 1.25 Cheyenne $ 120 $ 180$ 150 $ 45 1,200 $ 0.80 Salt Lake $ 80 $ 130$ 120 $ 38 1,500 $ 0.95 3,700 Transp. & Prod. costs ($/unit) Warehouses Capacity Annual Fixed Plant Kentucky Nebraska Arizona (#units) cost Million $ Atlanta $ 150 $ 190 $ 240 900 S 4.50 Boston $ 175 $ 210 $ 275 600 $ 6.80 Chicago $ 165 $ 220$ 200 1,200 $ 4.90 Denver $ 230$ 175 $ 120 800 $ 3.50 3,500 Transportation and production costs ($/unit) Retailers Annual Capacity Warehouses LA San Antonio Seattle NY Oklahoma City Fixed cost (#units) Millions Kentucky $ 90 $ 70 $ 135$ 65 $ 50 900$ 2.50 Nebraska $ 80 $ 85$ 95$ 180 $ 45 700 $ 1.80 Arizona $ 45 $ 55 $ 110 $ 220 $ 55 1,700 $ 3.90 Demand 900 500 400 800 600 3,300 Total demand = 3,200 Transportation and production costs ($ per 5 units) Manufacturing Plants Atlanta Boston Chicago Denver Raw material supplier Baltimore Cheyenne Santa Fe Salt Lake $ $ $ $ 500 $ 260 $ 400 $ 340 $ 410 $ 300 $ 260 $ 380$ 230 $ 480 $ 370 $ 250 $ 300 500 340 370 Capacity Annual Fixed cost (#units) Thousands 1,850 $ 33.60 1,590$ 47.25 1,810 $ 40.95 1,950 $ 47.25 7,200 270 Capacity (#units) un-limited un-limited un-limited un-limited Annual Fixed cost Thousand $ $ 27.30 $ 29.40 $ 24.15 $ 28.35 Transp. & Prod. costs ($ per 10 units) Distribution Centers Manufacturing Omaha Sprinfield Memphis Boise Plants Atlanta $ 230$ 250 $ 220$ Boston $ 260 $ 210 $ 180 $ 170 Chicago $ 250 $ 230$ 220 $ 170 Denver $ 120$ 250 $ 250 $ 290 Transportation and production costs ($ per 5 units) Warehouses Distribution Kentucky Amarillo Nebraska Arizona Centers Omaha $ 150 $ 120 $ 140$ 130 Sprinfield $ 120 $ 100 $ 160 $ 110 Memphis $ 140 $ 70 $ 170$ 80 Boise $ 70 $ 150 $ 150 $ 90 Transp. & Prod. costs ($ per 8 units) Retail Stores Oklahoma Warehouses LA San Antonio NY City Kentucky $ 100 $ 130 $ 150 $ 190 Amarillo $ 120 $ 200 $ 160 $ 180 Nebraska $ 100 $ 110 $ 100 $ 160 Arizona $ 140 $ 190$ 170 $ 130 Total demand 1,100 1,750 1,575 1,500 Notes: 1. Consider an annual fixed cost for each retail store to be $9,500. Capacity (#units) un limited un-limited un-limited un limited Annual Fixed cost Thousands $ 15.75 $ 19.95 $ 18.90 $ 16.80 Capacity (#units) un-limited un-limited un-limited un-limited Annual Fixed cost Thousands $ 19.95 $ 31.50 $ 18.90 $ 18.90


