Answered step by step
Verified Expert Solution
Link Copied!

Question

1 Approved Answer

Question 2 (30 points) We focus on the following subset of the variables: regime, oil, logGDPcp, and illit. Remove observations that have missing values in
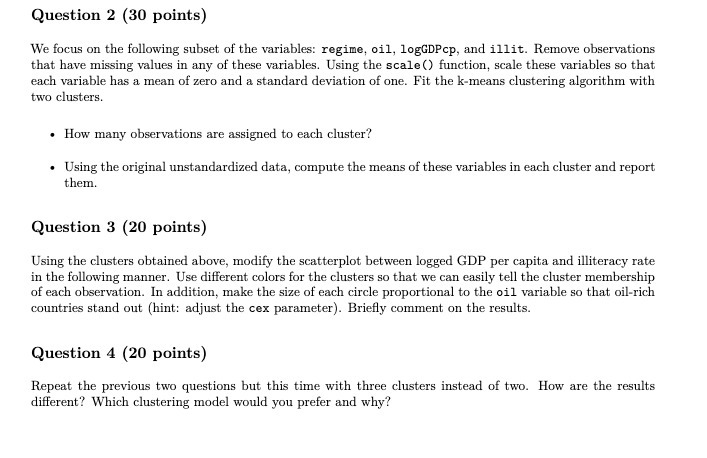
image text in transcribed
Question 2 (30 points) We focus on the following subset of the variables: regime, oil, logGDPcp, and illit. Remove observations that have missing values in any of these variables. Using the scale () function, scale these variables so that each variable has a mean of zero and a standard deviation of one. Fit the k-means clustering algorithm with two clusters. . How many observations are assigned to each cluster? . Using the original unstandardized data, compute the means of these variables in each cluster and report them. Question 3 (20 points) Using the clusters obtained above, modify the scatterplot between logged GDP per capita and illiteracy rate in the following manner. Use different colors for the clusters so that we can easily tell the cluster membership of each observation. In addition, make the size of each circle proportional to the oil variable so that oil-rich countries stand out (hint: adjust the cex parameter). Briefly comment on the results. Question 4 (20 points) Repeat the previous two questions but this time with three clusters instead of two. How are the results different? Which clustering model would you prefer and why

Step by Step Solution

There are 3 Steps involved in it

Step: 1

blur-text-image

Get Instant Access to Expert-Tailored Solutions

See step-by-step solutions with expert insights and AI powered tools for academic success

Step: 2

blur-text-image

Step: 3

blur-text-image

Ace Your Homework with AI

Get the answers you need in no time with our AI-driven, step-by-step assistance

Get Started

Recommended Textbook for

More Books

Students also viewed these Mathematics questions