Answered step by step
Verified Expert Solution
Question
1 Approved Answer
Question 2 [40 marks] The following charts show the monthly S&P 500 index and the FTSE 100 index over approximately the last ten years. FRED
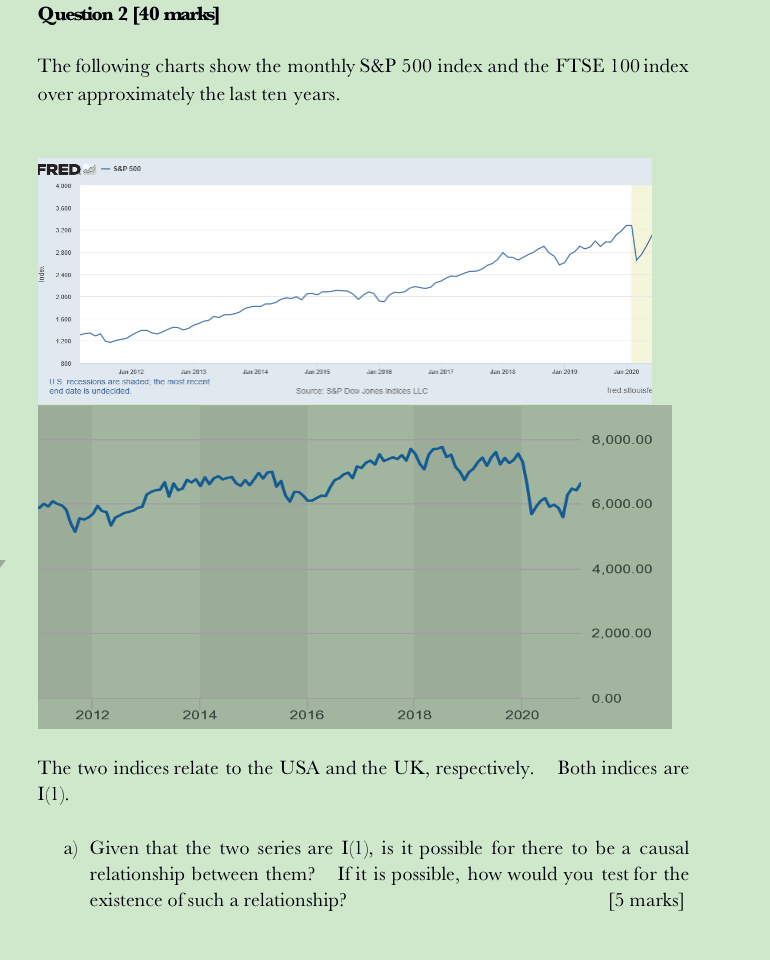
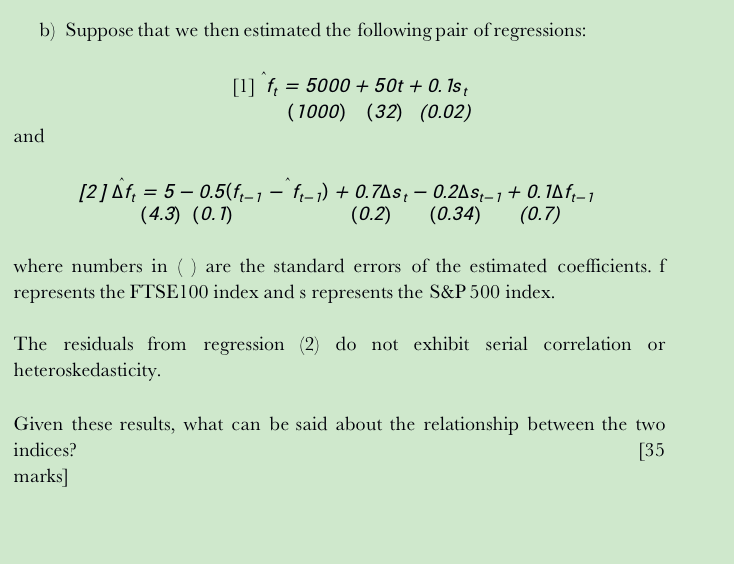
Question 2 [40 marks] The following charts show the monthly S&P 500 index and the FTSE 100 index over approximately the last ten years. FRED - S&P 500 4 000 30 3200 2900 ME 2000 1600 1200 800 Jan 2018 Jan 2012 Jan 2013 US recessions are shade the most recent end date is undecided Source: 3SP Dow Jones indices LLC Tredstouiste 8,000.00 6,000.00 4,000.00 2,000.00 0.00 2012 2014 2016 2018 2020 The two indices relate to the USA and the UK, respectively. Both indices are I(1). a) Given that the two series are I(1), is it possible for there to be a causal relationship between them? If it is possible, how would you test for the existence of such a relationship? [5 marks] b) Suppose that we then estimated the following pair of regressions: [1] F, = 5000 + 50t + 0.1s (1000) (32) (0.02) and [2] f, = 5 0.5(4-1 =^{-1) + 0.7As, 0.2A54-7+ 0.114-1 (4.3) (0.7) (0.2) (0.34) (0.7) where numbers in are the standard errors of the estimated coefficients. f represents the FTSE100 index and s represents the S&P 500 index. The residuals from regression (2do not exhibit serial correlation or heteroskedasticity. Given these results, what can be said about the relationship between the two indices? [35 marks]
Step by Step Solution
There are 3 Steps involved in it
Step: 1
Get Instant Access to Expert-Tailored Solutions
See step-by-step solutions with expert insights and AI powered tools for academic success
Step: 2
Step: 3
Ace Your Homework with AI
Get the answers you need in no time with our AI-driven, step-by-step assistance
Get Started