

Answered step by step
Verified Expert Solution
Question
1 Approved Answer
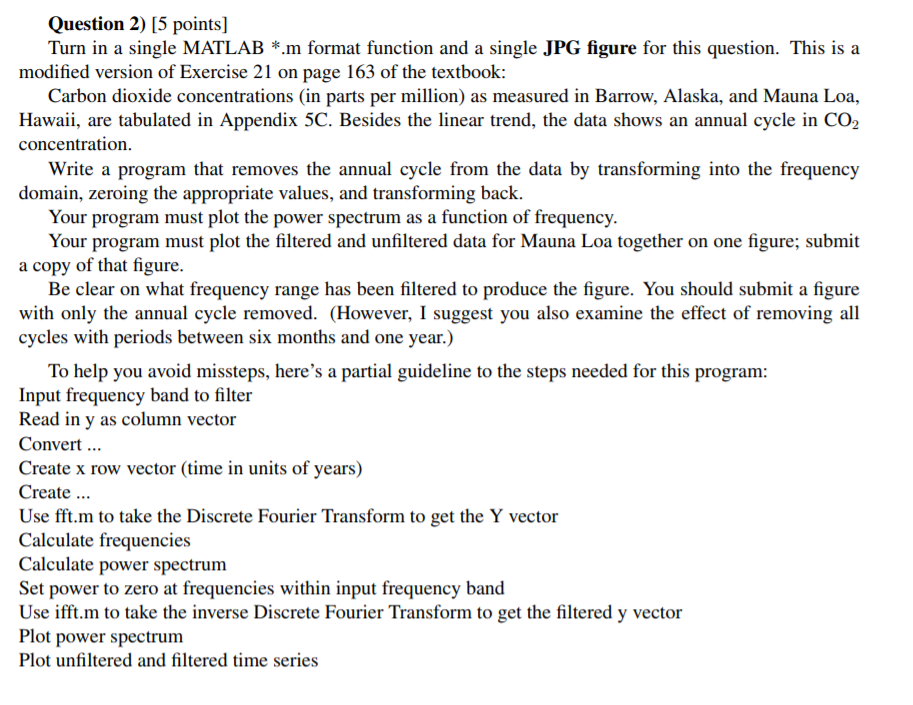
Question 2) [5 points] Turn in a single MATLAB *.m format function and a single JPG figure for this question. This is a modified version
Step by Step Solution
There are 3 Steps involved in it
Step: 1

Get Instant Access to Expert-Tailored Solutions
See step-by-step solutions with expert insights and AI powered tools for academic success
Step: 2

Step: 3
Ace Your Homework with AI
Get the answers you need in no time with our AI-driven, step-by-step assistance
Get Started
Databases In Telecommunications Ii Vldb 2001 International Workshop Dbtel 2001 Rome Italy September 10 2001 Proceedings Lncs 2209
Authors: Willem Jonker
2001st Edition
354042623X, 978-3540426233