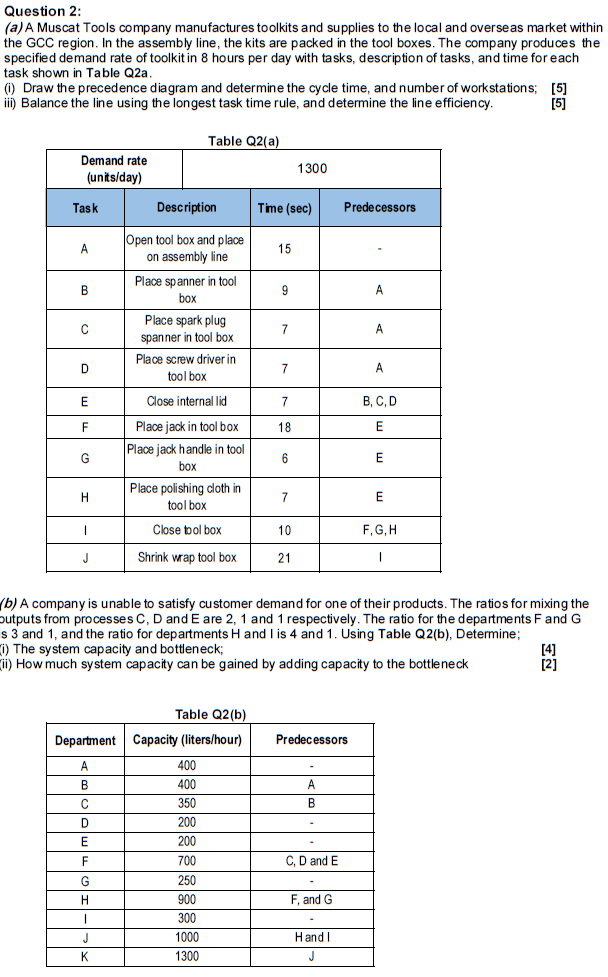
Question 2: (a) A Muscat Tools company manufactures toolkits and supplies to the local and overseas market within the GCC region. In the assembly line, the kits are packed in the tool boxes. The company produces the specified demand rate of toolkit in 8 hours per day with tasks, description of tasks, and time for each task shown in Table Q2a. (0) Draw the precedence diagram and determine the cycle time, and number of workstations; [5] iii) Balance the line using the longest task time rule, and determine the line efficiency. [5] Table Q2(a) Demand rate (units/day) 1300 Task Description Time (sec) Predecessors A 15 B 9 Open tool box and place on assembly line Place spanner in tool box Place spark plug spanner in tool box Place screw driver in tool box Close internal lid A D 7 A E 7 B,C,D F 18 E G 6 E . Place jack in tool box Place jack handle in tool box Place polishing cloth in tool box Close bol box Shrink wrap tool box 7 E 1 10 F,G,H J 21 - (b) A company is unable to satisfy customer demand for one of their products. The ratios for mixing the outputs from processes C, D and E are 2, 1 and 1 respectively. The ratio for the departments F and G s 3 and 1, and the ratio for departments H and I is 4 and 1. Using Table Q2(b), Determine; 1) The system capacity and bottleneck; [4] ii) How much system capacity can be gained by adding capacity to the bottleneck [2] Table Q2(b) Department Capacity (liters/hour) Predecessors A B A B C D 400 400 350 200 200 700 250 900 E F C, D and E G H F, and G 1 300 J K 1000 1300 H and I J Question 2: (a) A Muscat Tools company manufactures toolkits and supplies to the local and overseas market within the GCC region. In the assembly line, the kits are packed in the tool boxes. The company produces the specified demand rate of toolkit in 8 hours per day with tasks, description of tasks, and time for each task shown in Table Q2a. (0) Draw the precedence diagram and determine the cycle time, and number of workstations; [5] iii) Balance the line using the longest task time rule, and determine the line efficiency. [5] Table Q2(a) Demand rate (units/day) 1300 Task Description Time (sec) Predecessors A 15 B 9 Open tool box and place on assembly line Place spanner in tool box Place spark plug spanner in tool box Place screw driver in tool box Close internal lid A D 7 A E 7 B,C,D F 18 E G 6 E . Place jack in tool box Place jack handle in tool box Place polishing cloth in tool box Close bol box Shrink wrap tool box 7 E 1 10 F,G,H J 21 - (b) A company is unable to satisfy customer demand for one of their products. The ratios for mixing the outputs from processes C, D and E are 2, 1 and 1 respectively. The ratio for the departments F and G s 3 and 1, and the ratio for departments H and I is 4 and 1. Using Table Q2(b), Determine; 1) The system capacity and bottleneck; [4] ii) How much system capacity can be gained by adding capacity to the bottleneck [2] Table Q2(b) Department Capacity (liters/hour) Predecessors A B A B C D 400 400 350 200 200 700 250 900 E F C, D and E G H F, and G 1 300 J K 1000 1300 H and I J


