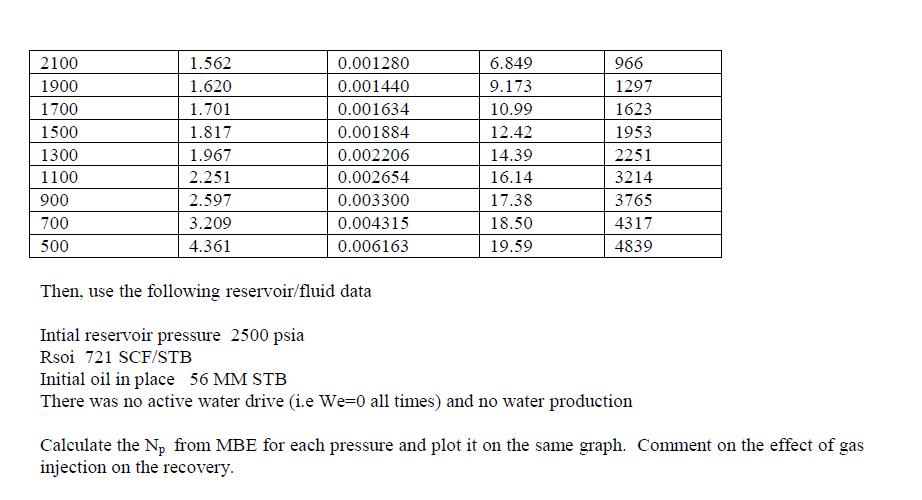
Question: Plot the Pressure vs Np in Table 3 . Pressure psia Bt. bbl/STB Bg, bbl/SCF Np. MM STB Rp. SCF/STB 2500 1.498 0.001048 2300


Plot the Pressure vs Np in Table 3 . Pressure psia Bt. bbl/STB Bg, bbl/SCF Np. MM STB Rp. SCF/STB 2500 1.498 0.001048 2300 1.523 0.001155 3.741 716 2100 1.562 0.001280 6.849 966 1900 1.620 0.001440 9.173 1297 1700 1.701 0.001634 10.99 1623 1500 1.817 0.001884 12.42 1953 1300 1.967 0.002206 14.39 2251 1100 2.251 0.002654 16.14 3214 900 2.597 0.003300 17.38 3765 700 3.209 0.004315 18.50 4317 500 4.361 0.006163 19.59 4839 Then, use the following reservoir/fluid data Intial reservoir pressure 2500 psia Rsoi 721 SCF/STB Initial oil in place 56 MM STB There was no active water drive (i.e We-0 all times) and no water production Calculate the Np from MBE for each pressure and plot it on the same graph. Comment on the effect of gas injection on the recovery.
Step by Step Solution
3.39 Rating (149 Votes )
There are 3 Steps involved in it
Initial Reservoir Pressure 2500 psia Rsoi 721 SCFSTB Initial oil in place 56 MM STB There was no act... View full answer

Get step-by-step solutions from verified subject matter experts


