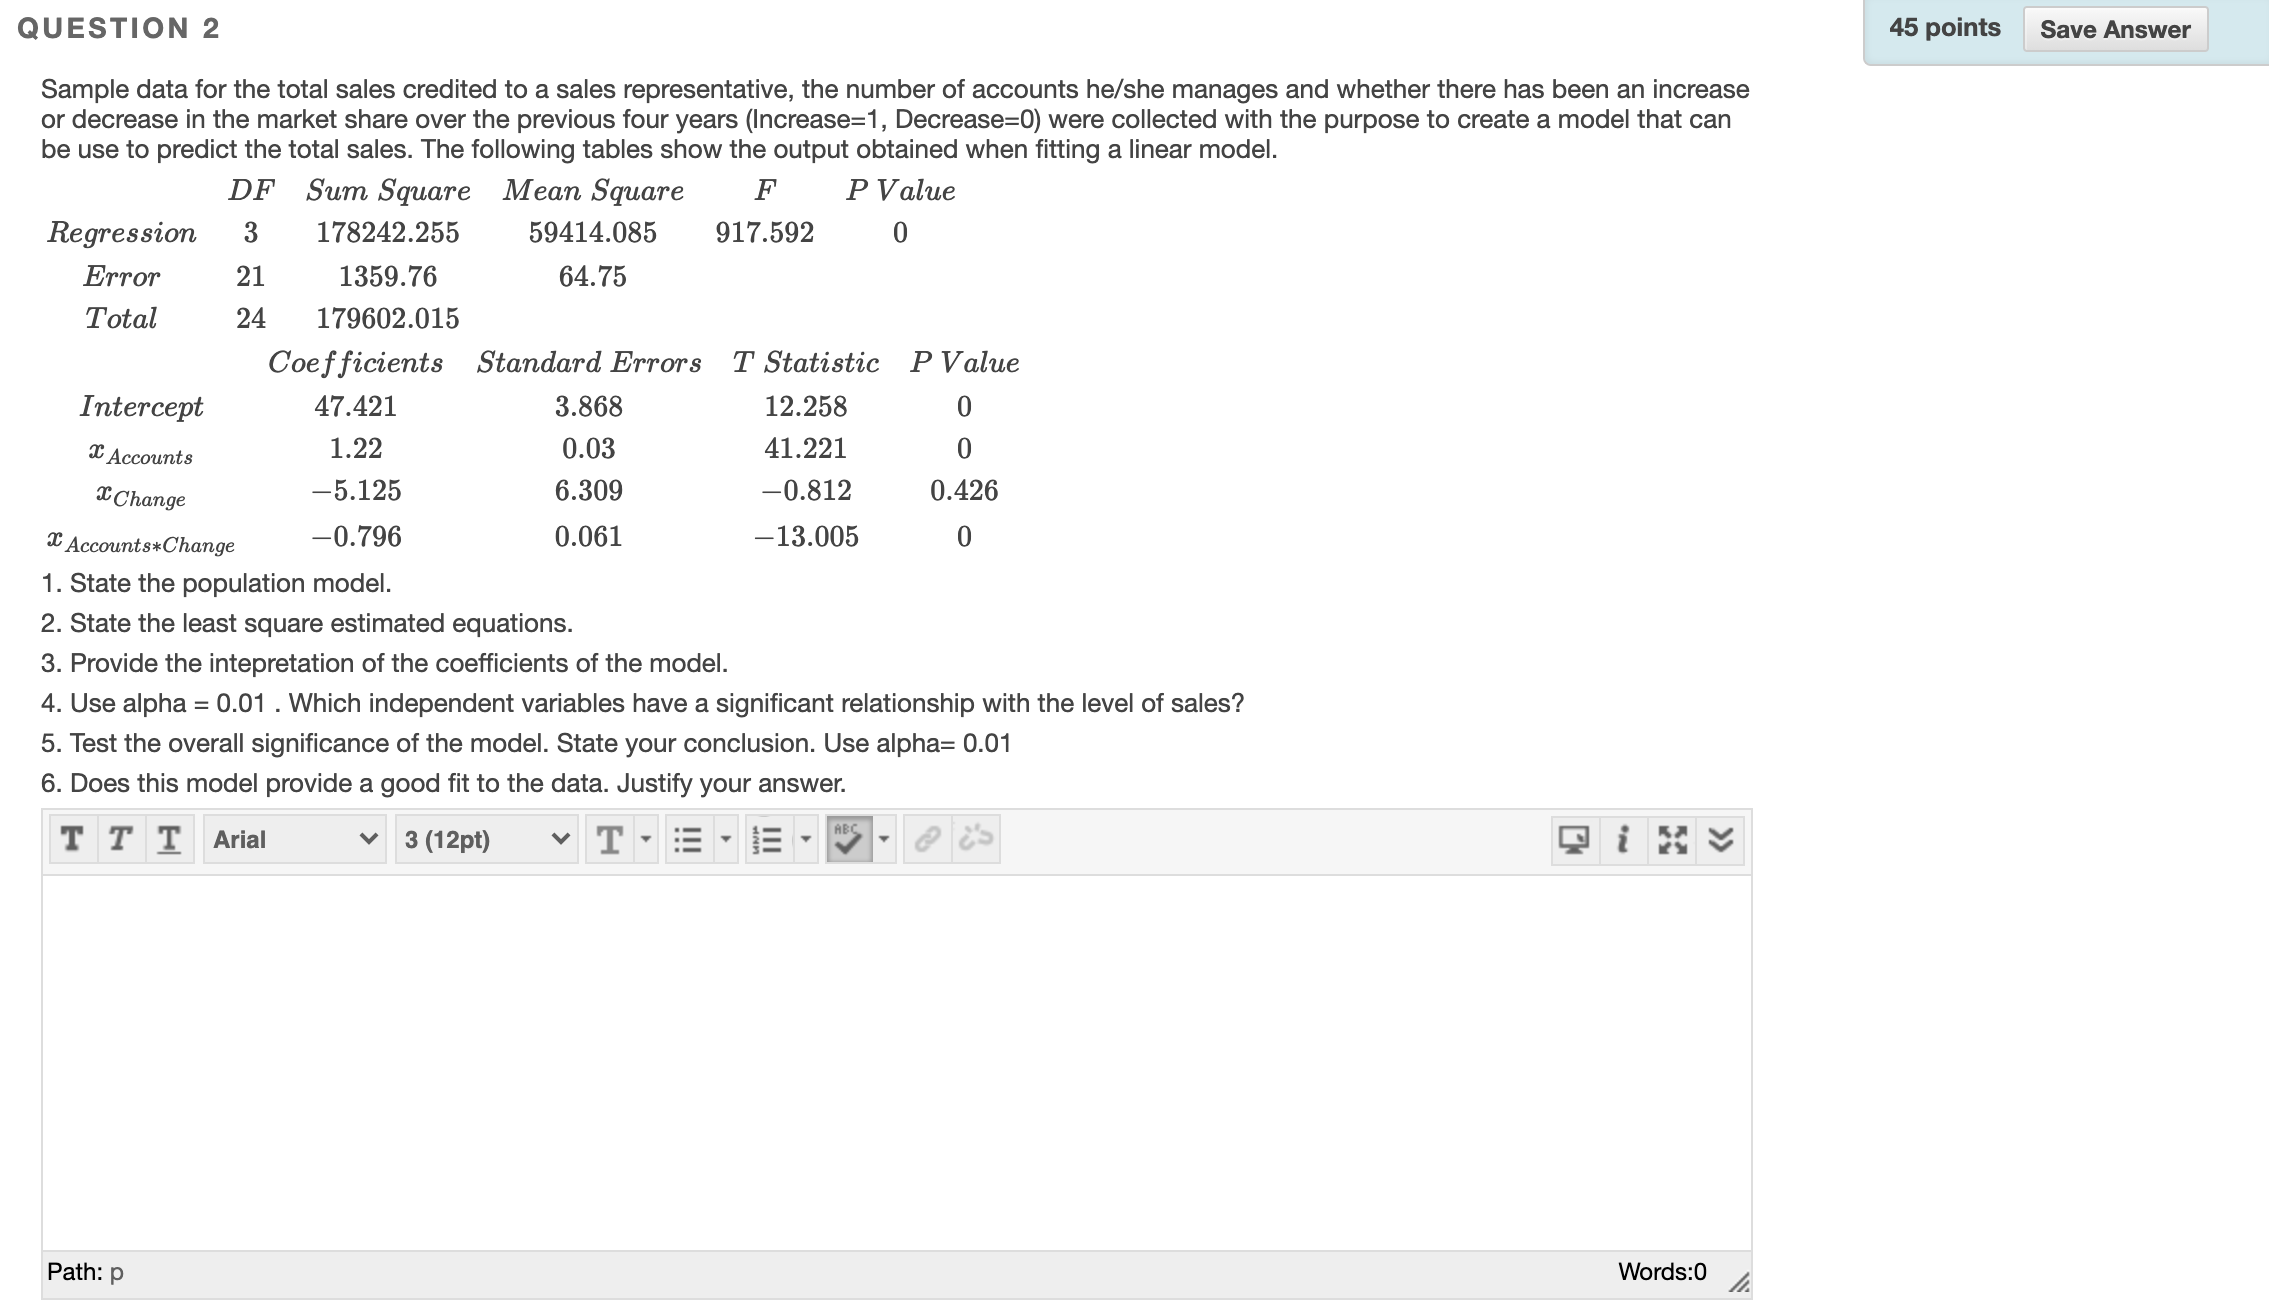
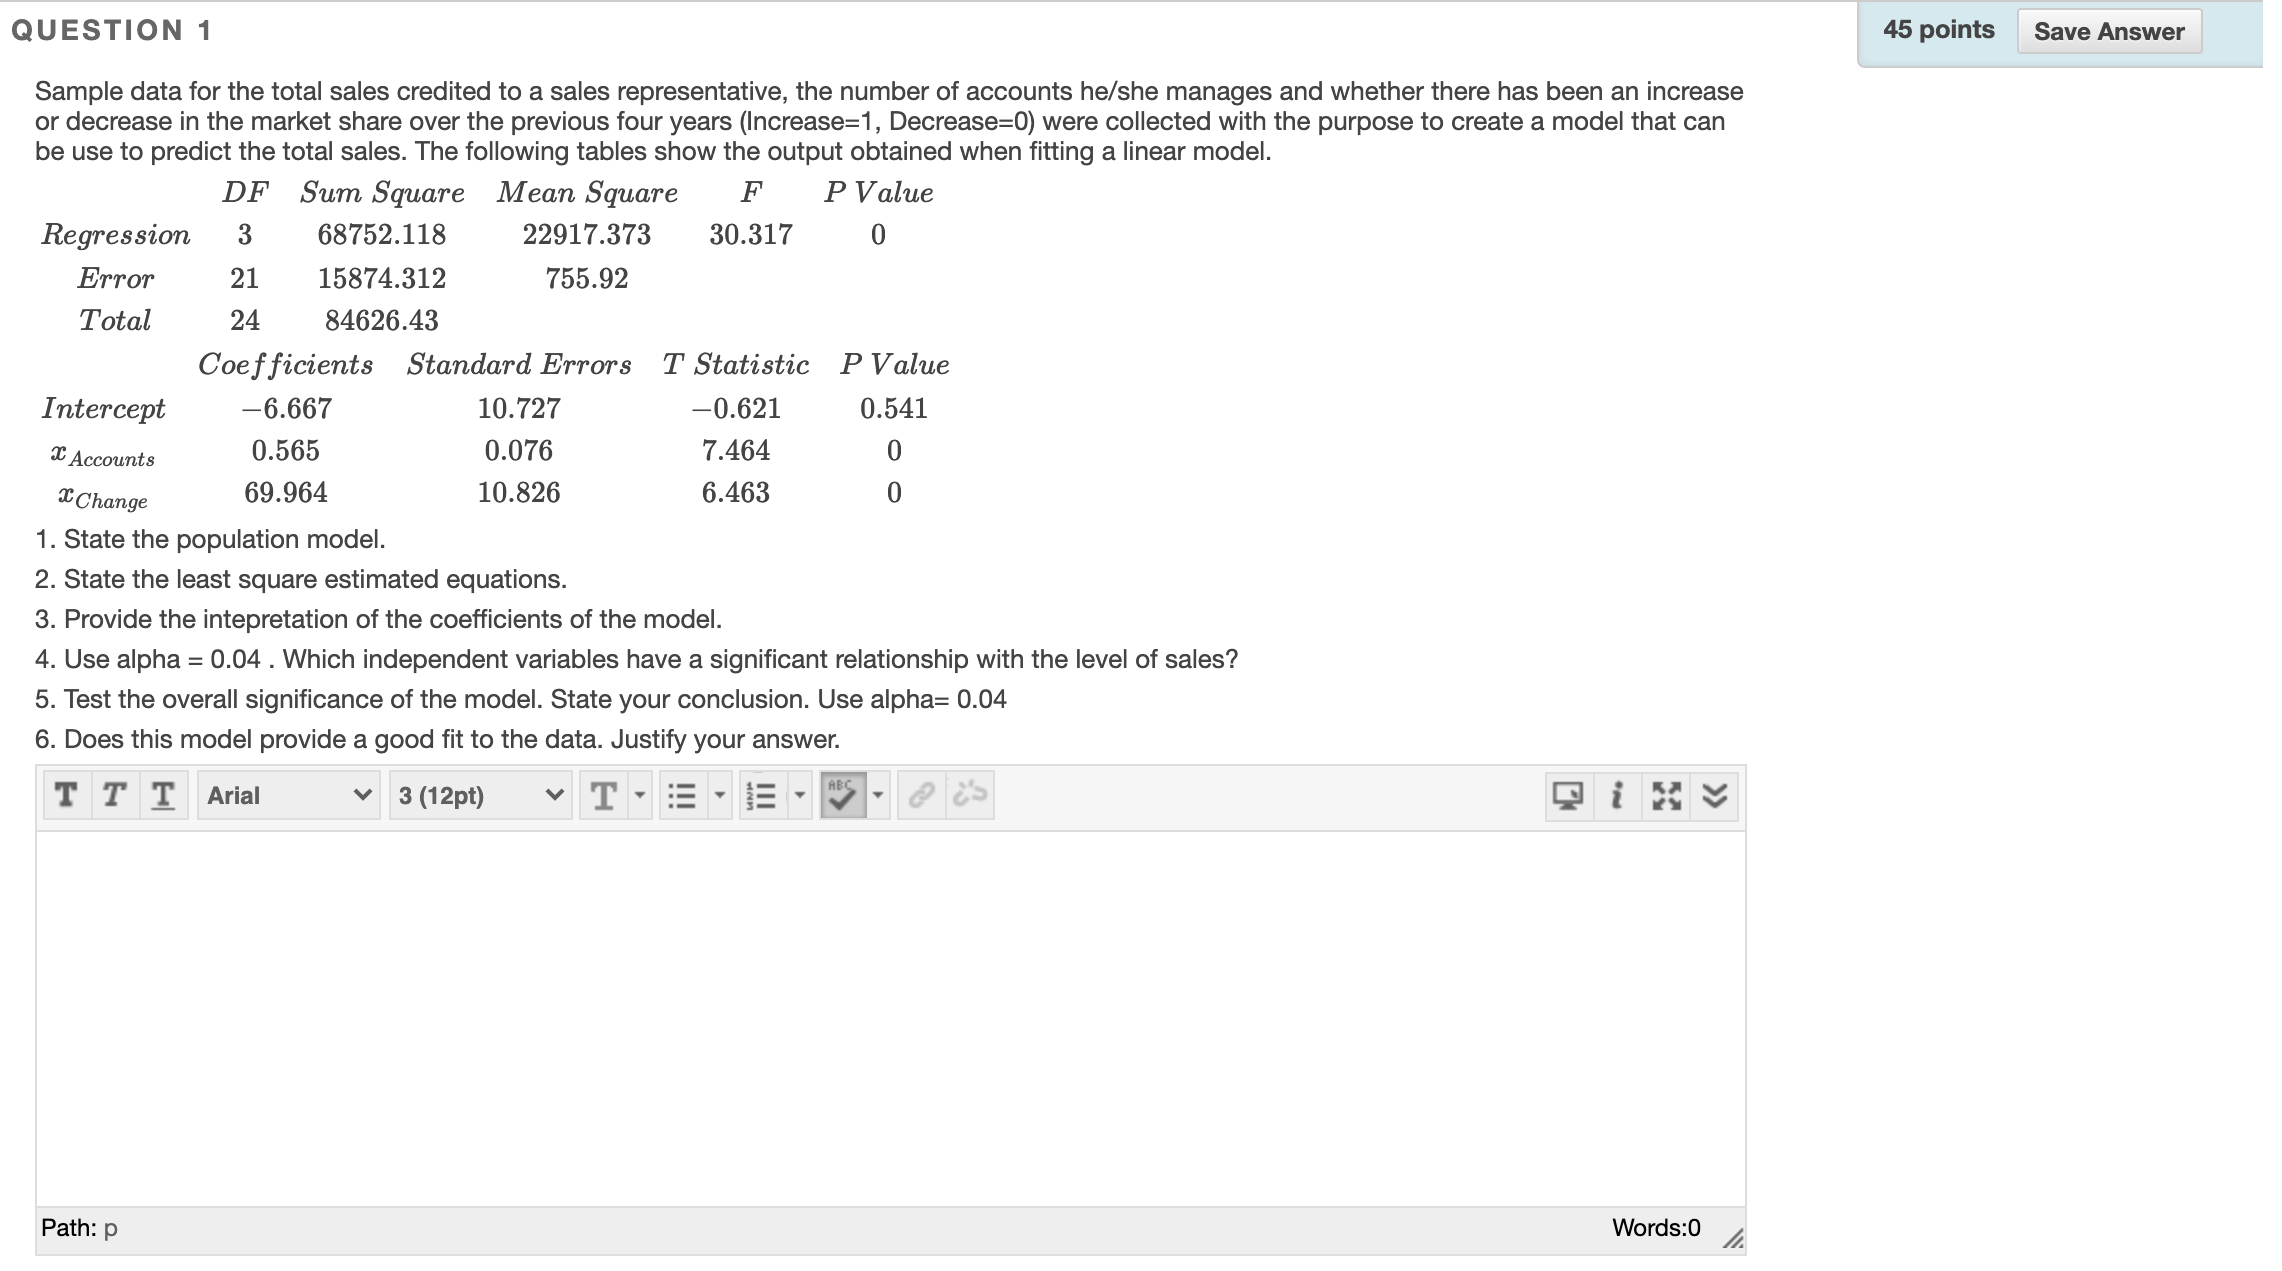
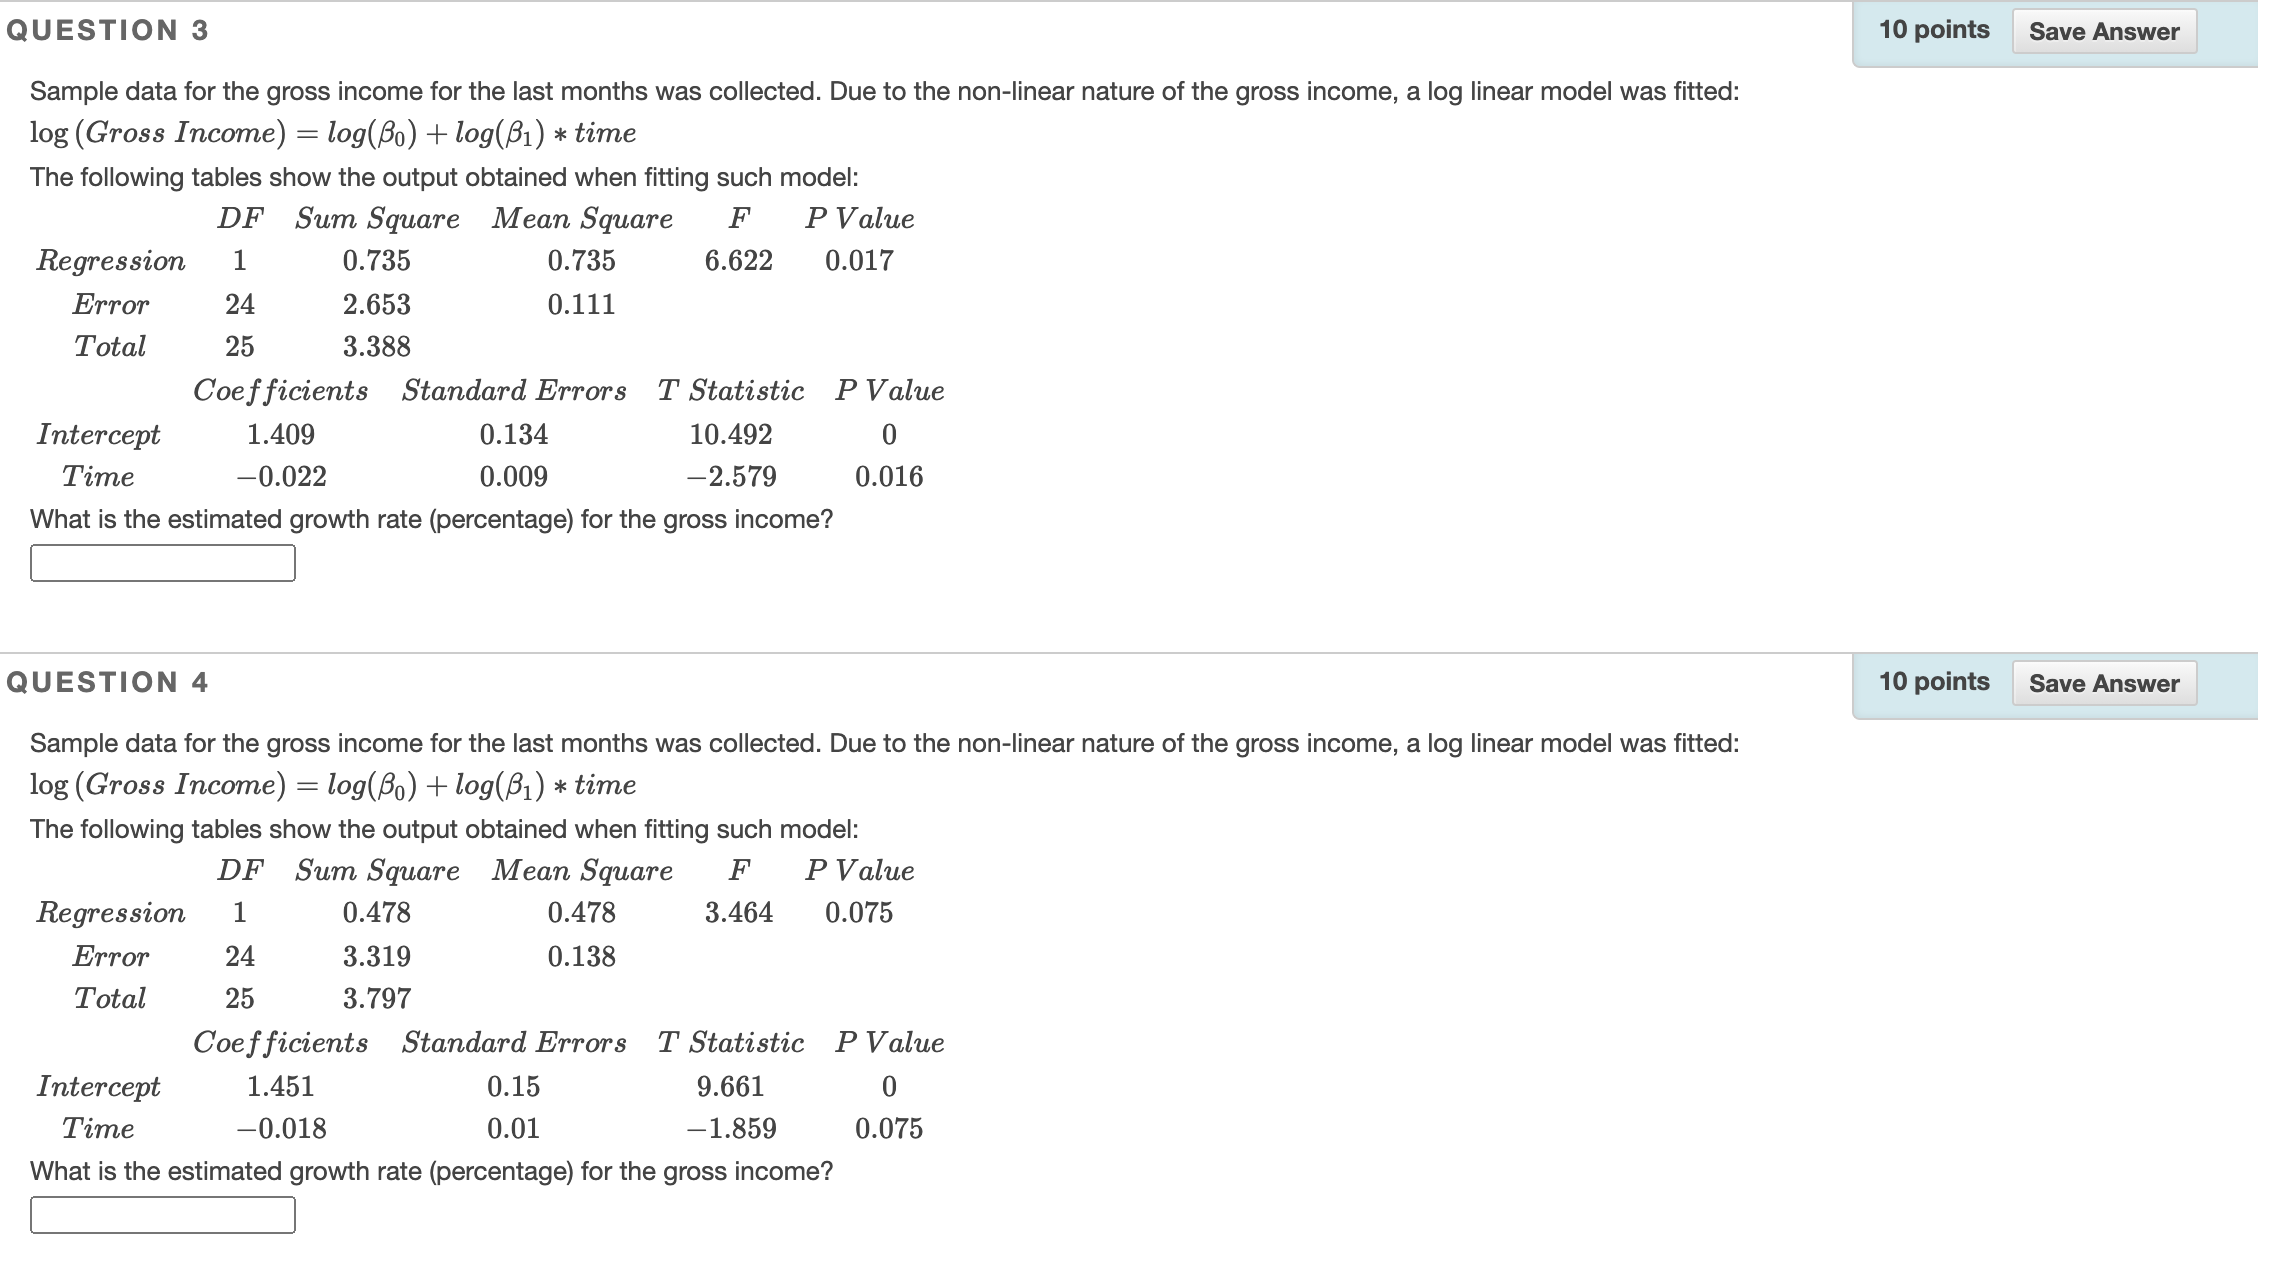
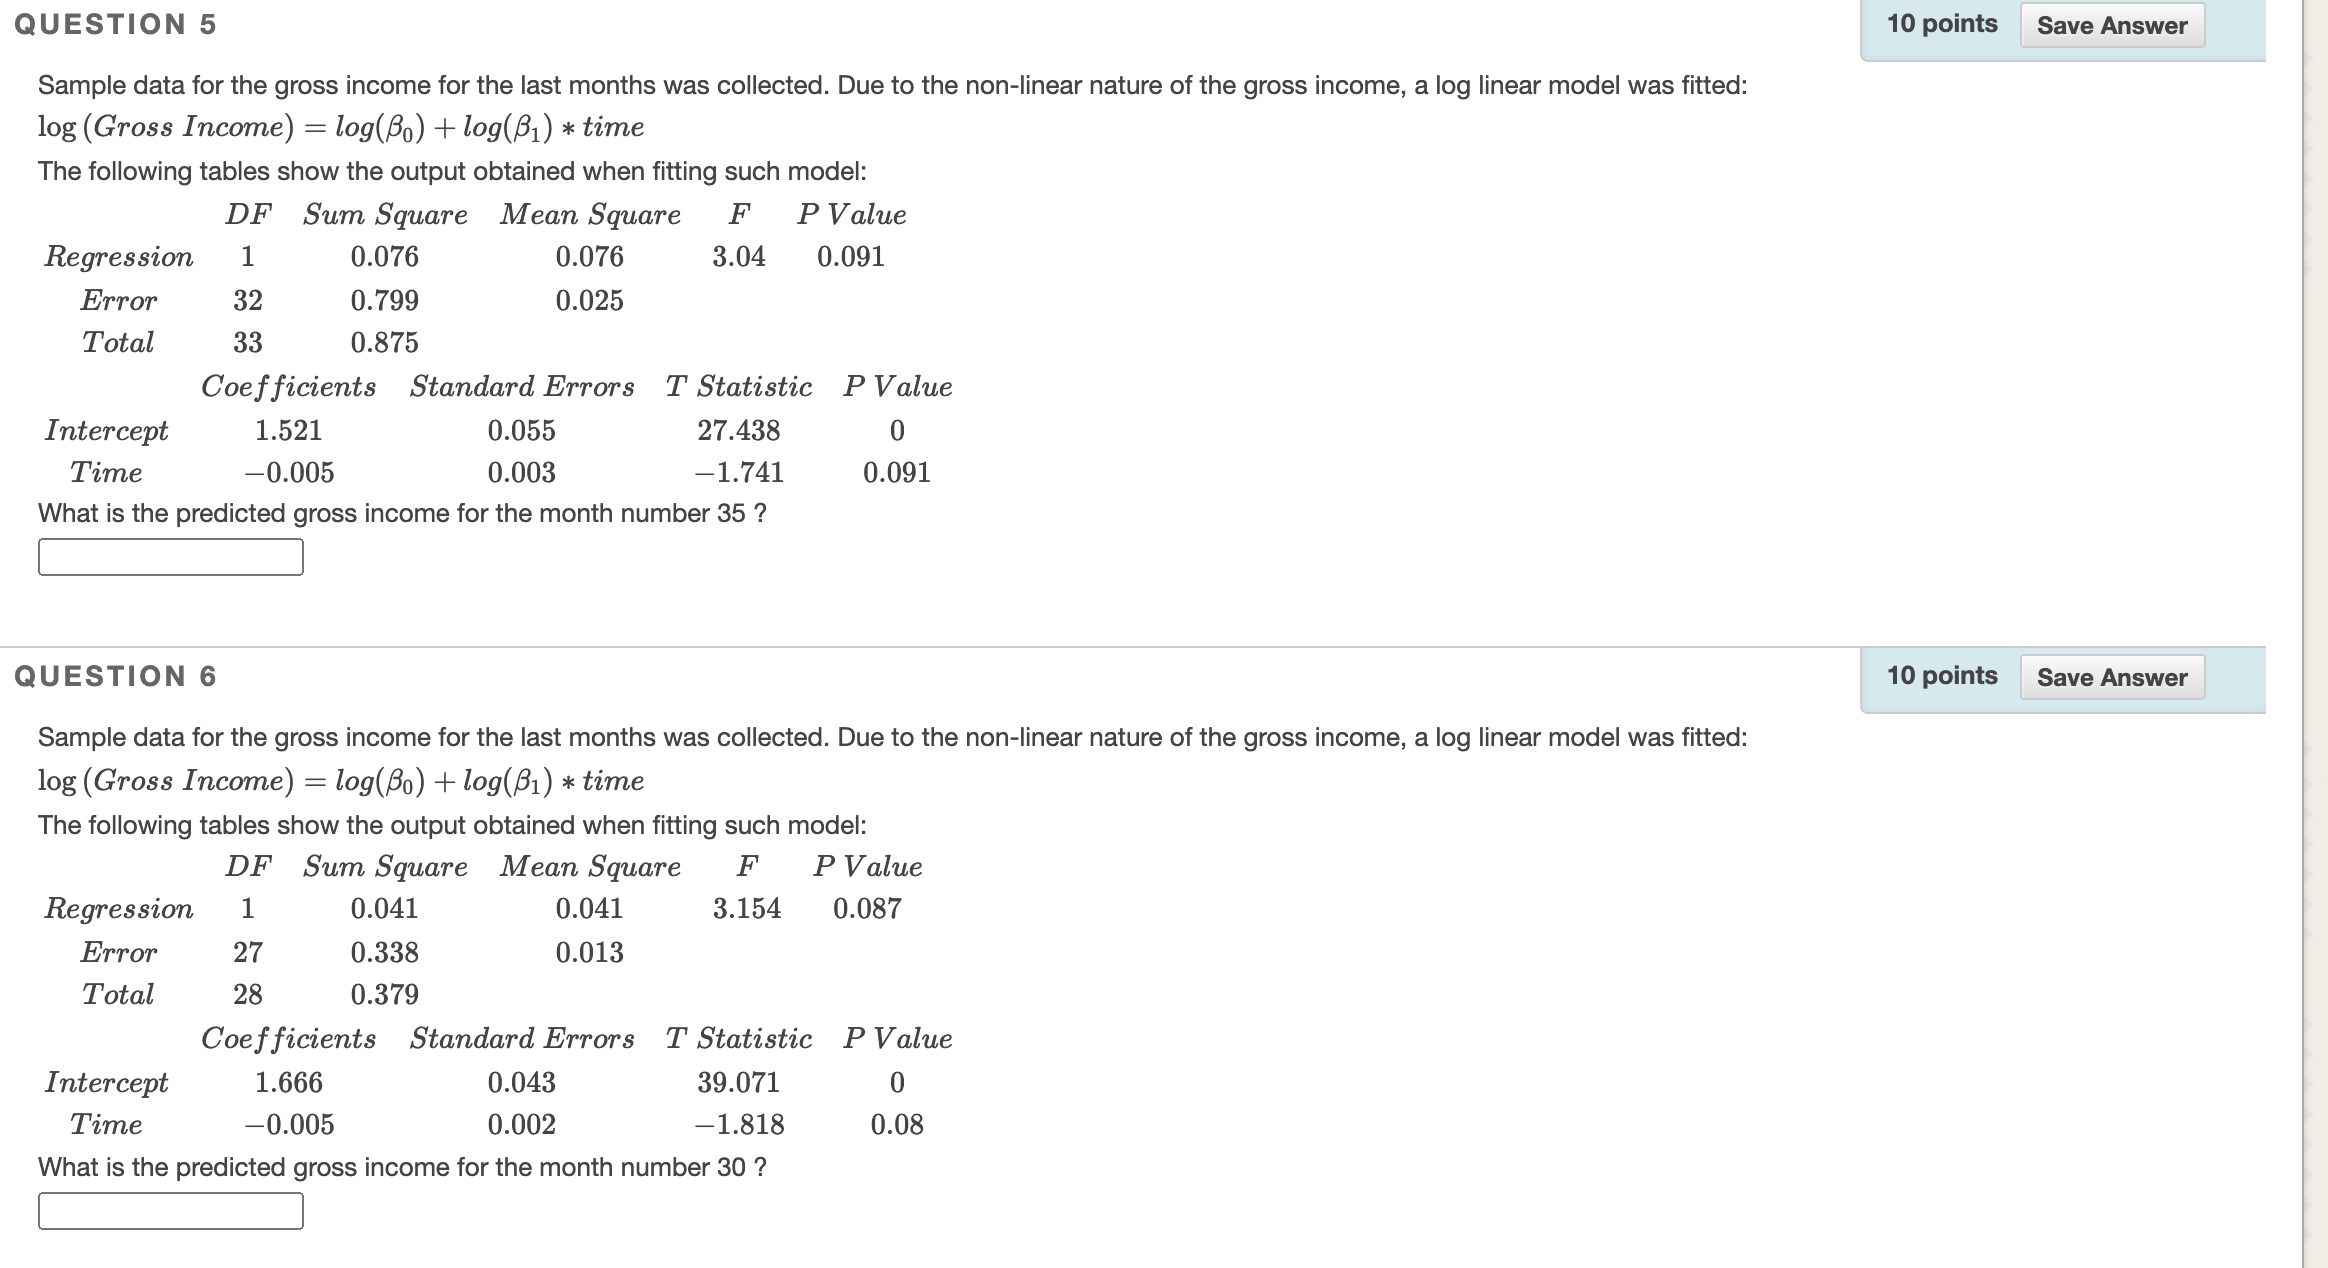
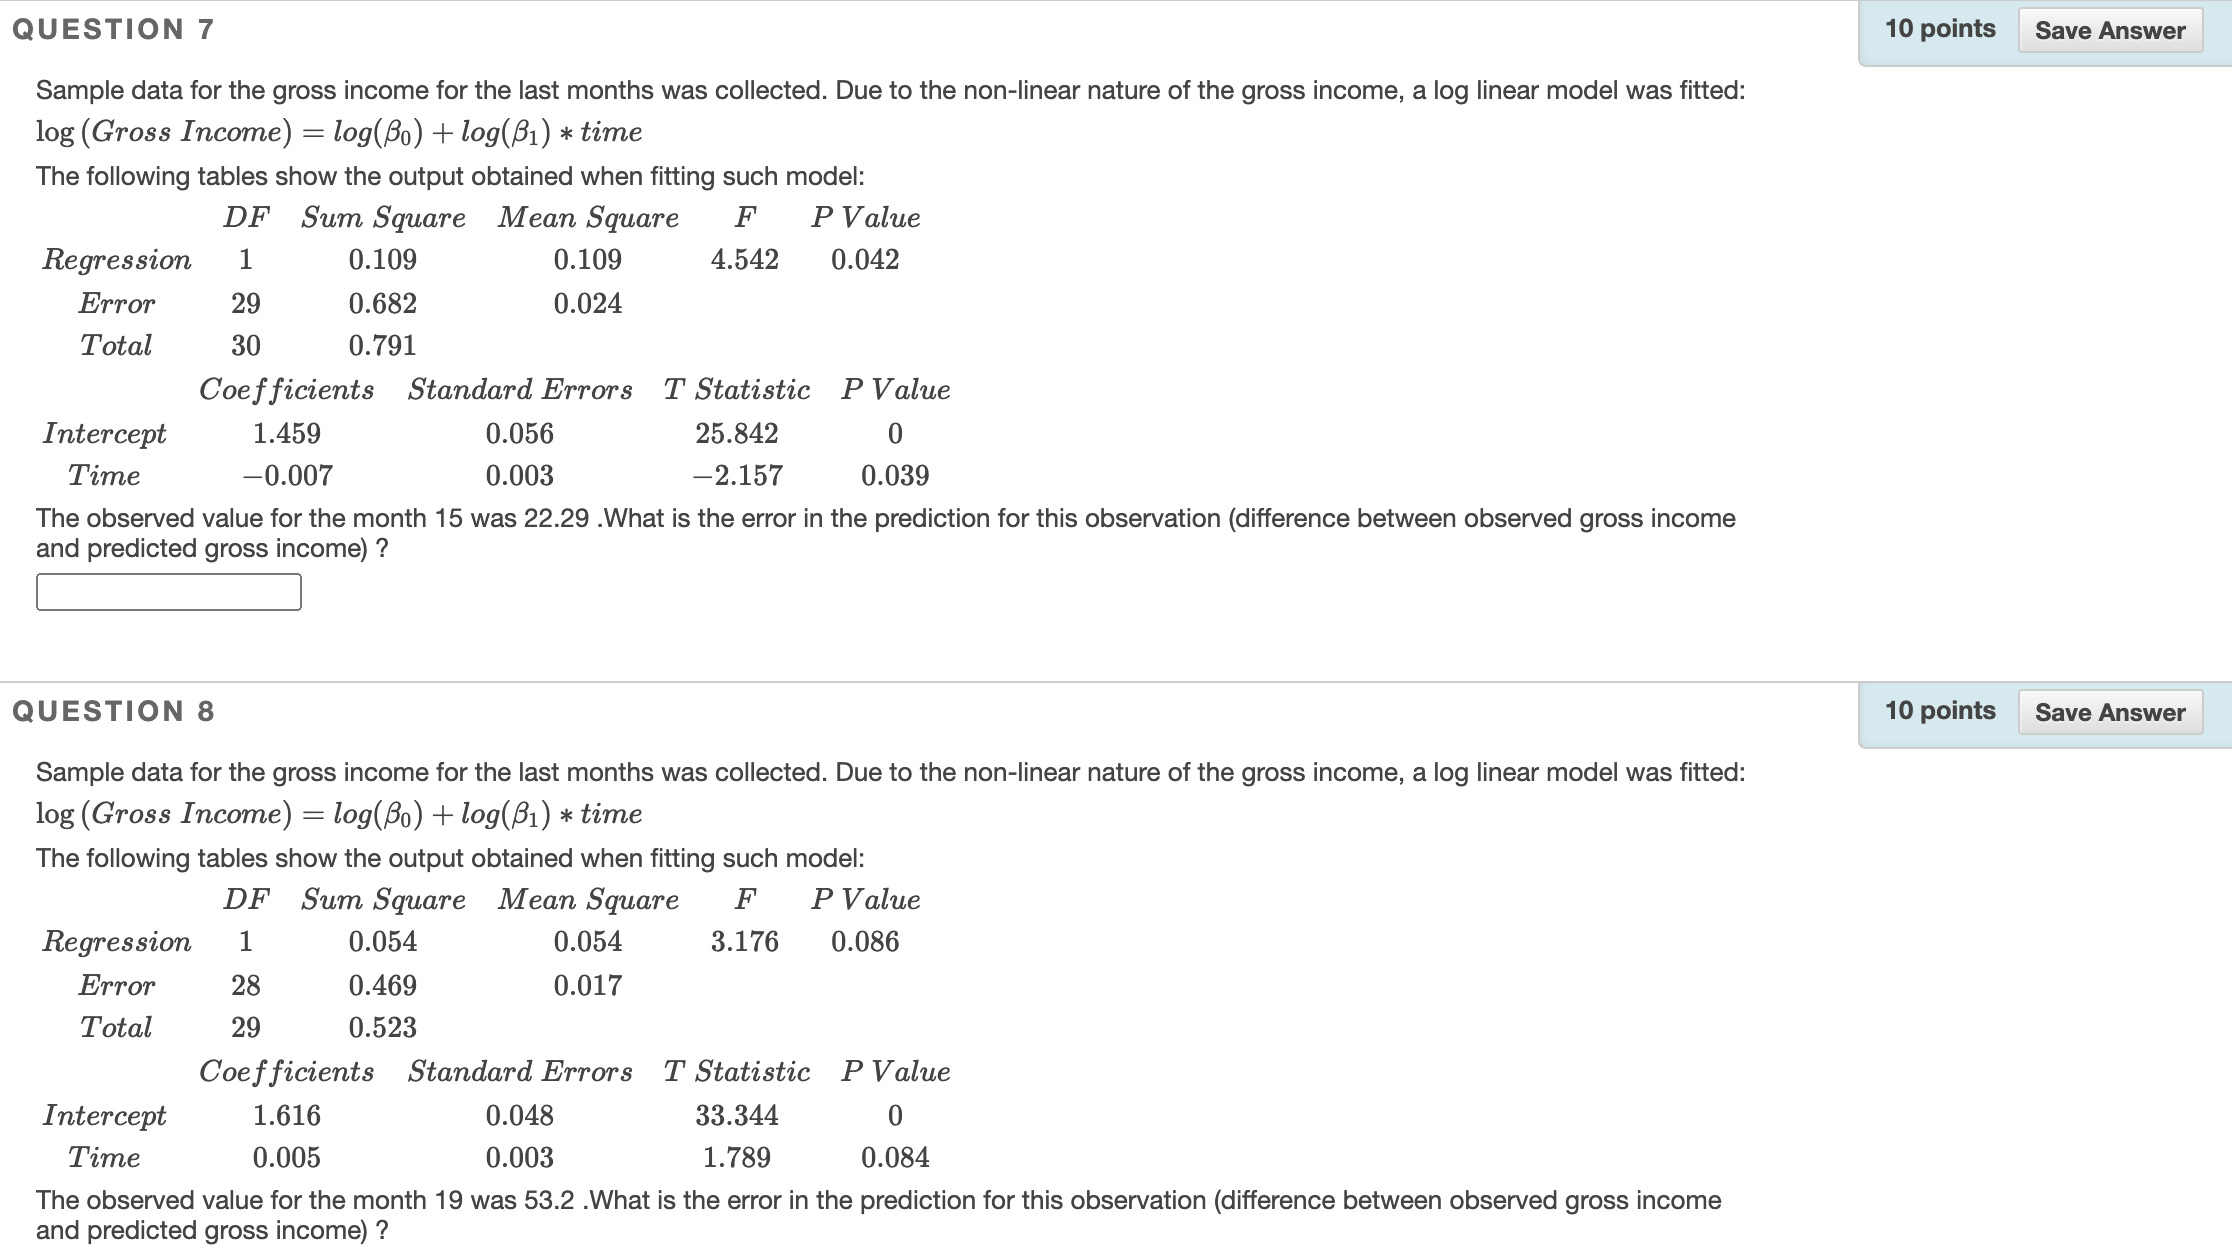
QUESTION 2 ' aspoim SaveAnswer Sample data for the total sales credited to a sales representative, the number of accounts he/she manages and whether there has been an increase or decrease in the market share over the previous four years (Increase=1, Decrease=0) were collected with the purpose to create a model that can be use to predict the total sales. The following tables show the output obtained when fitting a linear model. DF Sum Square Mean Square F P Value Regression 3 178242.255 59414.085 917.592 0 Error 21 1359.76 64.75 Total 24 179602.015 Coefficients Standard Errors T Statistic P Value Intercept 47.421 3.868 12.258 0 mm"... 1.22 0.03 41.221 0 mom... 5.125 6.309 0.812 0.426 \"mmwhme 0.796 0.061 13.005 0 1. State the population model. 2. State the least square estimated equations. 3. Provide the intepretation of the coefficients of the model. 4. Use alpha = 0.01 . Which independent variables have a significant relationship with the level of sales? 5. Test the overall significance of the model. State your conclusion. Use alpha: 0.01 6. Does this model provide a good fit to the data. Justify your answer. 11': Arial va(12pt) VT'EE'E'J- c965 @3328 L Path: p Words:0 / QUESTION 1 ' 45points SaveAnswer Sample data for the total sales credited to a sales representative, the number of accounts he/she manages and whether there has been an increase or decrease in the market share over the previous four years (lncrease=1, Decrease=0) were collected with the purpose to create a model that can be use to predict the total sales. The following tables show the output obtained when fitting a linear model. DF Sum Square Mean Square F P Value Regression 3 68752.118 22917.373 30.317 0 Error 21 15874.312 755.92 Total 24 84626.43 Coefficients Standard Errors T Statistic P Value Intercept 6.667 10.727 O.621 0.541 \"mm 0.565 0.076 7.464 0 mChange 69.964 10.826 6.463 0 1. State the population model. 2. State the least square estimated equations. 3. Provide the intepretation of the coefficients of the model. 4. Use alpha = 0.04 . Which independent variables have a significant relationship with the level of sales? 5. Test the overall significance of the model. State your conclusion. Use alpha: 0,04 6. Does this model provide a good t to the data. Justify your answer. '1' T I Arial v 3(12pt) V '1' ' SE ' 35 ' \"1'69 6'3 l3 3: 3 L Path: p Wordszo /' QUESTION 3 ' 1opoinu sangnswer Sample data for the gross income for the last months was collected. Due to the non-linear nature of the gross income, a log linear model was fitted: log (Gross Income) = log(o) + log(l) * time The following tables show the output obtained when fitting such model: DF Sum Square Mean Square F P Value Regression 1 0.735 0.735 6.622 0.017 Error 24 2.653 0.111 Total 25 3.388 Coefficients Standard Errors T Statistic P Value Intercept 1.409 0.134 10.492 0 Time 0.022 0.009 2.579 0.016 What is the estimated growth rate (percentage) for the gross income? : QUESTION 4 ' 10poin|s SaveAnswer Sample data for the gross income for the last months was collected. Due to the non-linear nature of the gross income, a log linear model was fitted: log (Gross Income) = log(/90) + log(l) * time The following tables show the output obtained when fitting such model: DF Sum Square Mean Square F P Value Regression 1 0.478 0.478 3.464 0075 Error 24 3.319 0.138 Total 25 3.797 Coefficients Standard Errors T Statistic P Value Intercept 1.451 0.15 9.661 0 Time 0.018 0.01 1.859 0.075 What is the estimated growth rate (percentage) for the gross income? I: QUESTION 5 ' 10poln|s SaveAnswer Sample data for the gross income for the last months was collected. Due to the non-linear nature of the gross income, a log linear model was fitted: log (Gross Income) = log(,60) + log(,81) * time The following tables show the output obtained when tting such model: DF Sum Square Mean Square F P Value Regression 1 0.076 0.076 3.04 0.091 Error 32 0.799 0.025 Total 33 0.875 Coefficients Standard Errors T Statistic P Value Intercept 1.521 0.055 27.438 0 Time 0.005 0.003 1.741 0.091 What is the predicted gross income for the month number 35 7 I: QUESTION 6 ' 10poin|s saveAnswerl Sample data for the gross income for the last months was collected. Due to the non-linear nature of the gross income, a log linear model was fitted: log (Gross Income) = log(o) + log(51) at: time The following tables show the output obtained when tting such model: DF Sum Square Mean Square F P Value Regression 1 0.041 0.041 3.154 0.087 Error 27 0.338 0.013 Total 28 0.379 Coefficients Standard Errors T Statistic P Value Intercept 1.666 0.043 39.071 0 Time 0.005 0.002 1.818 0.08 What is the predicted gross income for the month number 30 '? QUESTION 7 Sample data for the gross income for the last months was collected. Due to the non-linear nature of the gross income, a log linear model was fitted: log (Gross Income) = log(,Bo) + log(,81) * time The following tables show the output obtained when fitting such model: DF Sum Square Mean Square F P Value Regression 1 0.109 0.109 4.542 0.042 Error 29 0.682 0.024 Total 30 0.791 Coefficients Standard Errors T Statistic P Value Intercept 1.459 0.056 25.842 0 Time 0.007 0.003 2.157 0.039 The observed value for the month 15 was 22.29 .What is the error in the prediction for this observation (difference between observed gross income and predicted gross income) ? QUESTION 8 Sample data for the gross income for the last months was collected. Due to the non-linear nature of the gross income, a log linear model was fitted: log (Gross Income) = log(,Bo) + log(,81) * time The following tables show the output obtained when fitting such model: DF Sum Square Mean Square F P Value Regression 1 0.054 0.054 3.176 0.086 Error 28 0.469 0.017 Total 29 0.523 Coefficients Standard Errors T Statistic P Value Intercept 1.616 0.048 33.344 0 Time 0.005 0.003 1.789 0.084 The observed value for the month 19 was 53.2 .What is the error in the prediction for this observation (difference between observed gross income and predicted gross income) ? 10 points Save Answer 10 points Save